 Prior Trading Day Summary:
On Wednesday stocks traded between losses and gains but by the close the SPX was up 9 points to 5918. Intraday the index slipped to a low of 5874 which was not as low as Jan 2or Dec 20. Volume was lower at 4.5 billion shares traded and 64% of all volume was moving lower as were 54% of all stocks.
The NASDAQ saw 9.1 billion shares traded with 69% of all volume trading lower and 64% of all stocks falling. It managed to rally late in the day and closed down just 10 points to 19,478.
Overall despite the gyrations in the markets again on Wednesday, the indexes are still primarily trending sideways. Bond yields remain the primary culprit for weighing on stocks but that may change on Friday when we get the December Non-Farm Payroll Report.
Let’s review the technical indicators at the close on Wed Jan 8 2025 to see what they can tell us about Fri Jan 10 2025.
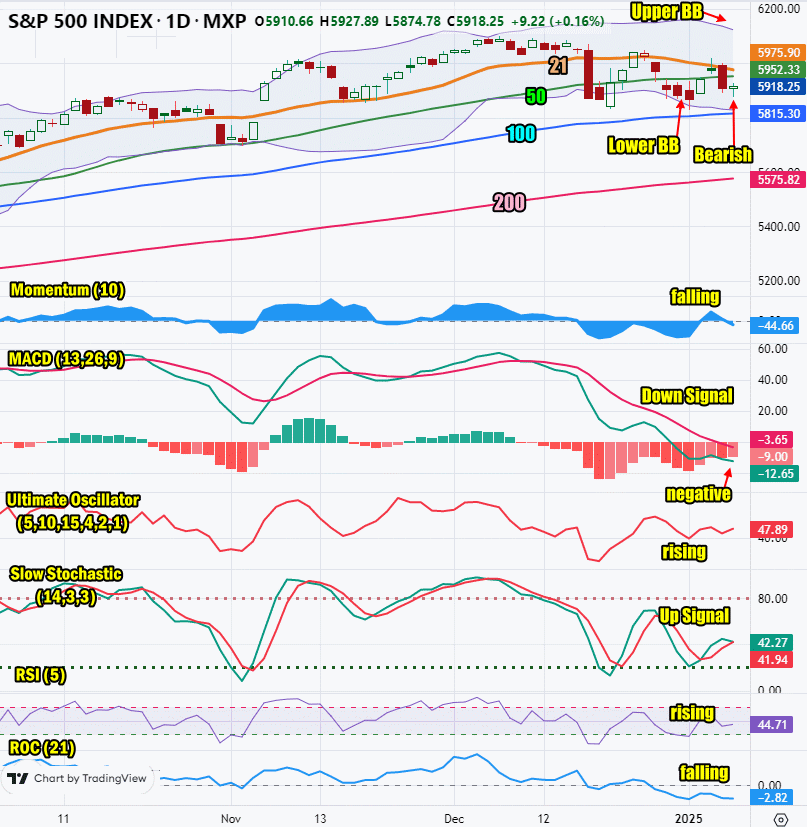
Stock Market Outlook: SPX Closing Chart For Wed Jan 8 2025
The index closed below both the 21 day and the 50 day moving averages. This is bearish.
The closing candlestick is bearish but also signals that if the employment numbers meet expectations there is a chance for a bounce.
The 21 day moving average fell back to 5975 which is bearish. It may fall below the 50 day on Friday which would be another down signal.
The 50 day moving average is rising and closed at 5952 which is bullish.
The 100 day moving average is rising and closed at 5815 which is bullish.
The 200 day moving average is rising and closed at 5575 which is bullish.
The Lower Bollinger Band is below the 50 day and moving lower which is bearish. It may fall below the 100 day shortly which would be another bearish signal. The Upper Bollinger Band is falling which is bearish.
The S&P chart is more bearish than bullish for Friday.

SPX Stock Market Outlook review of Wed Jan 8 2025
Stock Market Outlook: Technical Indicators Review
Momentum: Momentum is falling and back negative.
|
MACD Histogram: MACD (Moving Averages Convergence / Divergence) issued a down signal on Tuesday Dec 10 2024 . The down signal did not gain strength on Wednesday and the histogram shows the down signal is losing strength.
|
Ultimate Oscillator: The Ultimate Oscillator is rising but actually trending more sideways than either clearly up or down since Dec 24.
|
Slow Stochastic: The Slow Stochastic has an up signal in place that is ready to turn to a down signal on Friday.
|
Relative Strength Index: The RSI signal is rising.
|
Rate of Change: The rate of change signal is falling and signaling Friday will end lower.
|
Stock Market Outlook: Support and Resistance Levels |
| 6100 is strong resistance |
| 6090 is resistance |
| 6070 is resistance |
| 6050 is resistance |
| 6025 is resistance |
| 6015 is resistance |
| 6000 is resistance |
| 5990 is resistance |
| 5970 is resistance |
| 5950 is resistance |
| 5900 is support |
| 5890 is support |
| 5875 is support |
| 5850 is support |
| 5830 is support |
| 5800 is support |
| 5780 is support |
| 5725 is support |
| 5700 is support |
Stock Market Outlook for Fri Jan 10 2025
Most of Friday, especially the opening, will be all about the December jobs numbers. Analysts are expecting a drop of 72,000 jobs to 155,000. They estimate the unemployment rate will remain at 4.2%. Any large deviation from estimates may see stocks slide, especially if bond yields jump. If the 30 year moves above 5%, stocks will have a hard time on Friday. Downside could first be limited to 5830, the low of Jan 2. If the SPX broke that level and closed below it, next support of any consequence is down at 5780 and then 5725.
The technical indicators are biased to the downside although it is interesting that the MACD technical indicator is losing strength to its down signal. That might end up as an early signal that stocks falling may be ending sometime next week. Meanwhile the closing candlestick while bearish, also signals that if the employment numbers are primarily in-line with estimates, we could see a bounce attempt. As you can see, much of the day rests on the December employment report.
Potential Economic and Political Market Moving Events
Monday:
9:45 S&P final services PMI came in slightly higher than expected at 56.8
10:00 Factory orders for November were lower than estimated at -0.4%
Tuesday:
8:30 Trade deficit came in slightly above estimated at -78.2 billion for November
10:00 ISM services were stronger than expected at 54.1% which pushed bond yields higher
10:00 Job openings surprised with a robust 8.1 million which again put pressure on bond yields
Wednesday:
8:15 ADP employment is estimated to fall to 136,000 from 146,000
8:30 Weekly Initial Unemployment Insurance Claims are expected to rise to 215,000 from 211,000
10:00 Wholesale inventories are estimated to fall to -0.2% from 0.2% prior
2:00 Minutes of Fed’s December FOMC meeting is not expected to strongly impact market action
3:00 Consumer credit is estimated to have fallen to $9.1 billion from $192 billion prior
Friday:
8:30 December employment report estimated to show 155,000 jobs versus 227,000 prior
8:30 December unemployment rate estimated to hold steady at 4.2%
8:30 Hourly wages are estimated to have slipped to 0.3% from 0.4% prior
8:30 Hourly wages year-over-year are estimated unchanged at 4.0%
10:00 University of Michigan consumer sentiment is estimated unchanged at 74.0

 Prior Trading Day Summary: