Prior Trading Day Summary:
On Thursday stocks started the day higher and attempted a bounce despite higher than expected numbers from the Weekly Initial Unemployment Insurance Claims. Unfortunately comments about tarifffs from President Trump sunk stocks again as investors remain nervous on what most feel is an unknown outcome.
The SPX fell 94 points and ended the day at 5861. The pullback is now down 3.1% from the high made just last Wednesday. 66% of all stocks were falling by the close and the index ended the day at the day’s low.
The NASDAQ lost 530 points as NVIDIA Stock (NVDA) failed to hold the early morning rally and plunged in the afternoon. 7.9 billion shares traded on Thursday with 70% of it moving lower followed by 71% of stocks on the index. This was the biggest one day decline since Jan 27 when the index lost 612 points.
Let’s review the SPX technical indicators from Thu Feb 27 2025 to see what to expect for Fri Feb 28 2025.
Stock Market Outlook: SPX Closing Chart For Thu Feb 27 2025
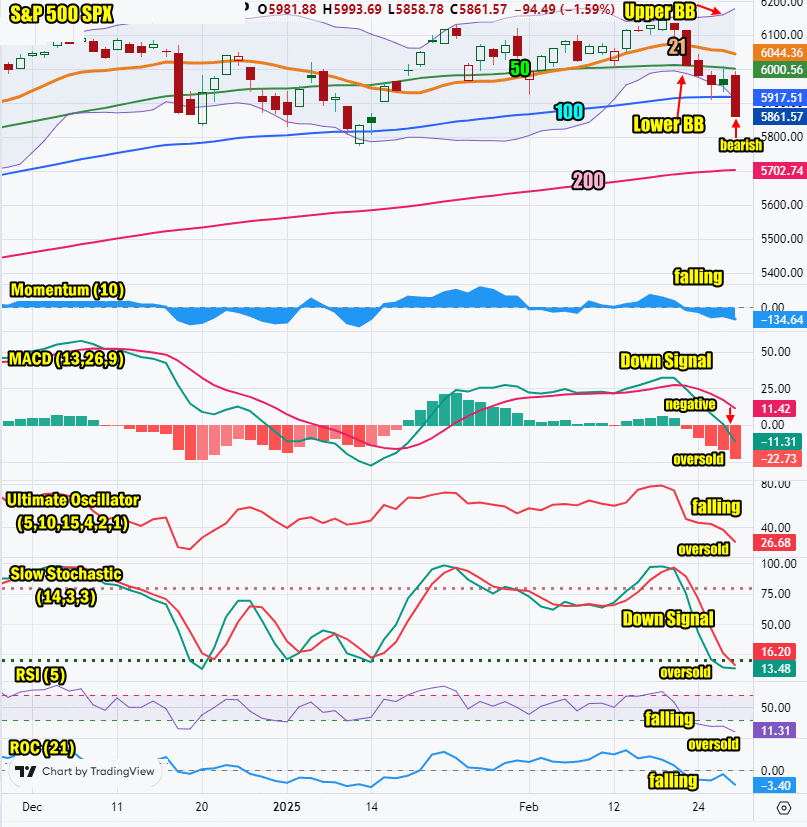
The index fell below the 100 day moving average and closed at the low. This is bearish although a bounce is likely with the index down 3.1% from its high from last week.
The closing candlestick no shadows, but indicates a bounce attempt is probable.
The 21 day moving average is falling and closed at 6044 which is bearish.
The 50 day moving average is falling and closed at 6000 which is bearish.
The 100 day moving average is falling and closed at 5917 which is bearish.
The 200 day moving average is rising and closed at 5702 which is bullish.
The Lower Bollinger Band is falling which is bearish at present. The Upper Bollinger Band is trending higher which signals the Bollinger Bands Squeeze is over and stocks are falling. This is bearish.
For Friday the SPX chart is bearish but a bounce is likely either today or early next week.

SPX Stock Market Outlook review of Thu Feb 27 2025
Stock Market Outlook: Technical Indicators Review
Momentum: Momentum is falling and negative.
|
MACD Histogram: MACD (Moving Averages Convergence / Divergence) issued a down signal on Mon Feb 21 2025. The down signal was stronger on Thu Feb 27 2025 and is oversold.
|
Ultimate Oscillator: The Ultimate Oscillator is falling and oversold.
|
Slow Stochastic: The Slow Stochastic has a down signal in place for a sixth day and is oversold.
|
Relative Strength Index: The RSI signal is falling and signaling oversold.
|
Rate of Change: The rate of change signal is falling, signaling Friday will end lower.
|
Stock Market Outlook: Support and Resistance Levels |
| 6150 is resistance |
| 6125 is resistance |
| 6100 is resistance |
| 6090 is resistance |
| 6070 is resistance |
| 6050 is resistance |
| 6025 is resistance |
| 6015 is resistance |
| 6000 is support |
| 5990 is support |
| 5970 is support |
| 5950 is support |
| 5900 is support |
| 5890 is support |
| 5875 is support |
| 5850 is support |
Stock Market Outlook for Fri Feb 28 2025
For Friday stocks are very oversold and a bounce is expected. The problem is sentiment has quickly changed to negative and that is pushing stocks lower. As stocks continue to fall, more investors sell out.
On Friday we get the Personal Income and Personal Consumption Expenditures. The SPX is deeply oversold but stocks can stay oversold longer than many investors imagine. That said, if there is no bounce on Friday, expect one at the start of next week.
Potential Economic and Political Market Moving Events
Monday:
No events
Tuesday:
9:00 S&P Case-Shiller home price index rose more than expected to 4.5%
10:00 Consumer confidence was weaker, coming in at 98.3
Wednesday:
10:00 New home sales were lower than estimates, coming in at 657,000, down from 734,000 prior.
Thursday:
8:30 Weekly Initial Unemployment Insurance Claims came in well above estimated at 242,000
8:30 Durable goods orders rose to 3.1% instead of 2.0% expected
8:30 GDP is estimated unchanged at 2.3%
10:00 Pending home sales rose only slightly by -4.9%, up from -5.5% prior.
Friday:
8:30 Personal income is estimated unchanged at 0.4%
8:30 Personal spending is estimated to have fallen to 0.1% from 0.7% prior
8:30 PCE Index is estimated unchanged at 0.3%
8:30 PCE year-over-year is estimated at 2.5% down slightly from 2.6% prior
8:30 Core PCE is estimated at 0.3% up from 0.2% prior
8:30 Core PCE year-over-year is estimated to have fallen slightly to 2.6% from 2.8% prior

