 Prior Trading Day Summary:
On Thursday disappointing earnings and lowered forward guidance from Walmart (WMT) ahead of the open, unnerved investors who just a day earlier had pushed the SPX to a new all-time high. Selling spread quickly and took in many stocks that were overvalued as well as those often referred to as “high flyers” such as Applovin Stock (APP) and Palantir Tech Stock (PLTR) to name just two. Selling at times was heavy but while it affected many stocks, not all sectors were moving lower. The VIX Index, known by many analysts as the fear indicator rose just 39 cents to $15.66.
The NASDAQ fell back below 20,000 as it lost 93 points ending the day at 19,962. 56% of all volume was traded lower and 60% of all stocks were falling on the NASDAQ by the close but overall volume was just 7.5 billion, a drop of 900 million shares from Wednesday. Normally if markets are going to come apart, volumes rise, not fall.
The chance this is a one day event is probably slim but a larger drop does not look likely for Friday. Let’s review the closing technical indicators from Thu Feb 20 2025 to see what to expect for Fri Feb 21 2025.
Stock Market Outlook: SPX Closing Chart For Thu Feb 20 2025
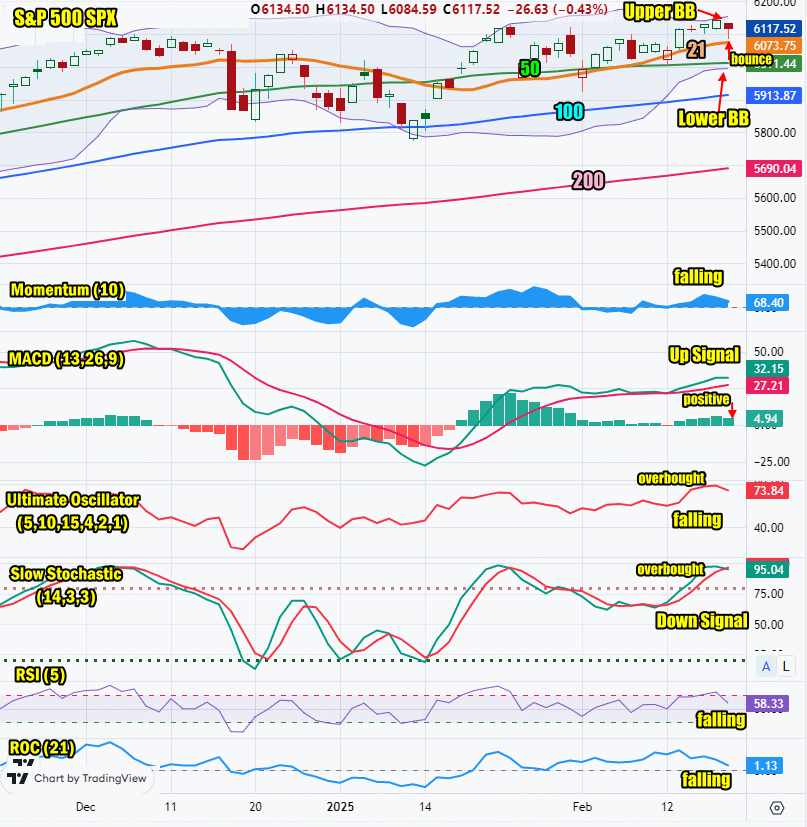
The index closed above all moving averages but below Wednesday’s high. This is bearish.
The closing candlestick fell almost to the 21 day on Thursday but then bounced and closed well off the lows. It is signaling a bounce is possible on Friday. This is bullish.
The 21 day moving average is rising and closed at 6073 which is bullish.
The 50 day moving average is rising and closed at 6011 which is bullish.
The 100 day moving average is rising and closed at 5913 which is bullish.
The 200 day moving average is rising and closed at 5690 which is bullish.
The Lower Bollinger Band is rising which is bullish. The Upper Bollinger Band is turning higher. The present Bollinger Bands Squeeze is starting to show signs it may be ending by next week but stocks may turn lower out of the squeeze. We won’t known for certain until next week.
For Friday the SPX chart is a bit bearish but still has some bullish signals.

SPX Stock Market Outlook review of Thu Feb 20 2025
Stock Market Outlook: Technical Indicators Review
Momentum: Momentum is falling and positive..
|
MACD Histogram: MACD (Moving Averages Convergence / Divergence) issued an up signal on Fri Jan 17 2025. The up signal lost strength on Thu Feb 20 2025.
|
Ultimate Oscillator: The Ultimate Oscillator is falling and not overbouht.
|
Slow Stochastic: The Slow Stochastic has a down signal in place and is overbought.
|
Relative Strength Index: The RSI signal is falling sharply and no longer overbought.
|
Rate of Change: The rate of change signal is falling, signaling Friday will end lower.
|
Stock Market Outlook: Support and Resistance Levels |
| 6150 is resistance |
| 6125 is resistance |
| 6100 is resistance |
| 6090 is resistance |
| 6070 is resistance |
| 6050 is resistance |
| 6025 is resistance |
| 6015 is resistance |
| 6000 is support |
| 5990 is support |
| 5970 is support |
| 5950 is support |
| 5900 is support |
| 5890 is support |
| 5875 is support |
| 5850 is support |
Stock Market Outlook for Fri Feb 21 2025
For Friday there is a good chance for a bounce attempt in the morning, but the day may start lower and then attempt a bounce. The technical signals are advising that the index may fall to the 21 day again and could even close lower for a second time on Friday.
There were indications on Thursday that the selling was focused on many stocks that had significant gains this year and were overvalued as far as PE ratios were concerned. This encompassed many of the financial stocks as well such as Goldman Sachs Stock (GS), JP Morgan Chase Stock (JPM), American Express Company Stock (AXP) and others. Walmart was ripe to dip back as it was trading at a 20 year historic PE over 40 times earnings. When earnings missed, this brought in selling. Even by the close with the stock down 6.5%, Walmart was at 40.0 times PE which is historically high for the stock. That means we will probably see more selling on Friday in Walmart. Economic events on Thursday also rattled some investors as the Weekly Initial Unemployment Insurance Claims was higher than anticipated which many analysts indicated could keep the Fed on hold for further rate cuts, longer than expected. Meanwhile those the leading economic indicators were -0.3% which was lower than expected. This opposes the outlook that the economy is growing. That means on Thursday investors were being handed a mix outlook and that pushed some into selling.
For Friday watch for a lower open, a bounce attempt and then more selling and a lower close to end the week.
Potential Economic and Political Market Moving Events
Monday:
No events
Tuesday:
8:30 Empire State manufacturing survey was much higher than estimated at 5.7
10:00 Home builder confidence index fell more than expected to 42
Wednesday:
8:30 Housing starts for Jan were lower at 1.37 million, well below estimates.
8:30 Building permits rose more than expected to 1.48 million
2:00 Minutes of Fed January FOMC meeting are not expected to make any difference to market direction today
Thursday:
8:30 Weekly Initial Unemployment Insurance Claims rose to 219,000 which also spooked some investors.
8:30 Philadelphia Fed manufacturing survey fell to 18.1 which was better than anticipated but well below the 44.3 prior
10:00 US leading economic indicators slipped to -0.3% which was below the 0.1% prior
Friday:
