Thursday saw the market react strongly to earnings from a number of the major companies. That mixed with an oversold condition and a decline in the GDP was enough to get a strong bounce from stocks. All three indexes moved higher.
The S&P rose 103 points to close at 4287. The NASDAQ jumped 382 points to 12,871 marking the best up day since March 16.
But stocks were very oversold and investors reacted when they saw the GDP rate which fell 1.4% as a potential signal that the Fed may curb the rising rates as the year progresses. Investors though, may be too early with that outlook.
Let’s review Thursday’s closing technical indicators to see what they can tell us about the final trading day of April 2022.
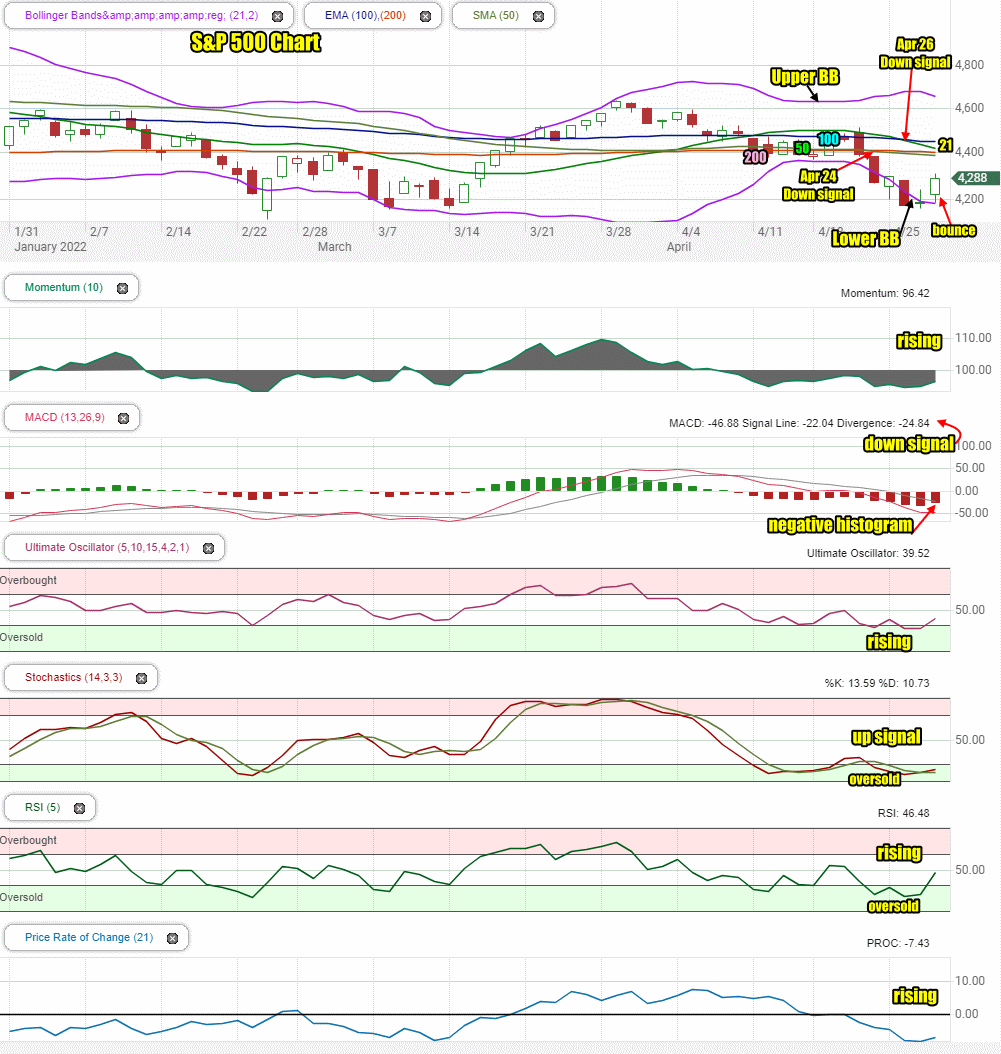
Stock Market Outlook Chart Comments At The Close on Thu Apr 28 2022
On Thursday the closing candlestick shows that Thursday was a bounce, more technical in nature than solidly bullish. This candlestick often signals a weaker follow-up on the next day and even a potential for a lower close.
With more down signals in place, the 21 day moving average is now preparing to fall back below the 200 day moving average. All the averages are continuing to fall which is still bearish.
The Bollinger Bands Squeeze is over, leaving behind a bearish signal with the Lower Bollinger Band falling deeper while the Upper Bollinger Band is now turning down.
The 200 day moving average is no longer rising and is now at the 4400 level.
The chart is still about 95% bearish for Friday.
Stock Market Outlook review of Thu Apr 28 2022
Stock Market Outlook: Technical Indicators Review:
Momentum: Momentum is rising and negative.
- Settings: For momentum I use a 10 period when studying market direction.
MACD Histogram: MACD (Moving Averages Convergence / Divergence) issued a down signal Friday April 8. On Thursday the down signal lost some strength but at minus 24.84, it is still very bearish. The histogram also lost a bit of strength but is also very bearish.
- Settings: For MACD Histogram, I am using the Fast Points set at 13, Slow Points at 26 and Smoothing at 9.
Ultimate Oscillator: The Ultimate Oscillator is rising.
- Settings: The Ultimate Oscillator settings are: Period 1 is 5, Period 2 is 10, Period 3 is 15, Factor 1 is 4, Factor 2 is 2 and Factor 3 is 1. These are not the default settings but are the settings I use with the S&P 500 chart set for 1 to 3 months.
Slow Stochastic: The Slow Stochastic has an up signal in place and is signaling oversold.
Settings: For the Slow Stochastic I use the K period of 14 and D period of 3. The Slow Stochastic tries to predict the market direction further out than just one day.
Relative Strength Index: The RSI signal is rising and no longer oversold.
- Settings: The relative strength index is set for a period of 5 which gives it 5 days of market movement to monitor. It is often the first indicator to show an overbought or oversold signal.
Rate of Change: The rate of change signal is rising slightly.
- Settings: Rate Of Change is set for a 21 period. This indicator looks back 21 days and compares price action from the past to the present. With the Rate Of Change, prices are rising when signals are positive. Conversely, prices are falling when signals are negative. As an advance rises the Rate Of Change signal should also rise higher, otherwise the rally is suspect. A decline should see the Rate Of Change fall into negative signals. The more negative the signals the stronger the decline.
Support and Resistance Levels To Be Aware Of:
4550 is light resistance
4525 is light resistance
4500 is resistance
4490 is light resistance
4475 is light resistance
4450 is light resistance
4400 is resistance
4370 is light support
4350 is light resistance
4300 is light resistance
4290 is light resistance
4270 was light support
4250 was good support
4225 was light support
4200 is good support
4150 is good support
4100 is light support
4050 is light support
4025 is light support
4000 is good support
Stock Market Outlook for Tomorrow – Fri Apr 29 2022
If you look at the support and resistance levels above you can see that 4300 and 4290 are now light resistance. On Thursday the index ran into selling as it reached the 4300 level. On Friday these two levels are still going to resist the bulls.
Amazon, Intel, Roku and others has poor results after hours on Friday and that means weakness will start, probably from the open. Even Apple, which beat on earnings and revenue, probably didn’t have a strong enough beat to stop investors from taking profits. From there though, dips in Apple are probably opportunities. For Amazon, more downside is likely even though a lot of analysts talked up the stock even with its horrendous earnings report. I would wait at least until next week to see where the stock may head. Many companies are discussing supply lines, rising costs and labor issues going forward and that will weigh on stocks. This makes every rally probably more a trading opportunity than a chance the S&P will race ahead and finally recover the old highs or even come close. I wouldn’t expect much to change until perhaps the late summer or early fall.
I didn’t post the Market Breadth Indicators for members tonight but suffice to say the bounce was great but the numbers failed to improve but continue to point to the SPX having a chance to move lower. For Friday I am expect a choppy day with a bias lower. I would continue to take advantage of bounces to lock in profits and raise capital for trades when the next dip lower comes.
Potential Market Moving Events
Thursday:
8:30 Initial jobless claims and continuing jobless claims were right in line with expectations. No sign of a labor market weakening.
8:30 Red GDP first estimate was -1.4%.
Friday:
8:30 Employment cost index
8:30 PCE Price Index
8:30 Core PCE price index
8:30 Nominal personal income and consumer spending
8:30 Real disposable incomes and real consumer spending
9:45 Chicago PMI
10:00 University of Michigan consumer sentiment and 5 year inflation expectations
Stock Market Outlook Archives
Morning Investing Strategy Notes for Mon Apr 7 2025
Stock Market Outlook for Mon Apr 7 2025 – Bounce Possible At Any Time But Still Bearish and Lower For Now

Morning Investing Strategy Notes for Fri Apr 4 2025

Stock Market Outlook for Fri Apr 4 2025 – All About The March Jobs Numbers

Morning Investing Strategy Notes for Thu Apr 3 2025

Stock Market Outlook for Thu Apr 3 2025 – Bearish Following Higher Than Expected Tariffs

Morning Investing Strategy Notes for Wed Apr 2 2025
Stock Market Outlook for Wed Apr 2 2025 – Tariffs Day – Still Bearish – Bounce Attempt Likely

Morning Investing Strategy Notes for Tue Apr 1 2025
Stock Market Outlook for Tue Apr 1 2025 – Nice Bounce But Still Bearish

Morning Investing Strategy Notes for Mon Mar 31 2025

Stock Market Outlook for Mon Mar 31 2025 – Bounce Attempt Likely But Still Bearish

Morning Investing Strategy Notes for Fri Mar 28 2025

Stock Market Outlook for Fri Mar 28 2025 – Weakness Into The Weekend

Morning Investing Strategy Notes for Thu Mar 27 2025

Stock Market Outlook for Thu Mar 27 2025 – Bounce Attempt

Morning Investing Strategy Notes for Wed Mar 26 2025
Stock Market Outlook for Wed Mar 26 2025 – A Little Weakness But Still Higher

Morning Investing Strategy Notes for Tue Mar 25 2025
