 Prior Trading Day Summary:
Thu Apr 10 2025 found stocks selling lower again despite Wednesday’s massive rally as China’s tariffs took center stage again. Nervous investors decided to take profits from Wednesday’s rally.
The S&P ended the day down 188 points which was a 39% drop from Wednesday’s rally. Volume fell back to 6.7 billion shares traded but new lows rose to 1160 which matches Monday’s drop. 85% of all volume was to the downside and 89% of all stocks were falling.
The NASDAQ lost 737 points which was a 39% drop from Wednesday’s rally of 1857 points. Volume was still very high at 12.3 billion shares traded. New lows jumped to 1491 which was still below Monday’s 1611 new lows. 70% of all volume was being traded lower on Thursday.
Let’s review the technical indicators at the close on Thu Apr 10 2025 to see what they predict for stocks on Fri Apr 11 2025.
Stock Market Outlook: SPX Closing Chart For Thu Apr 10 2025
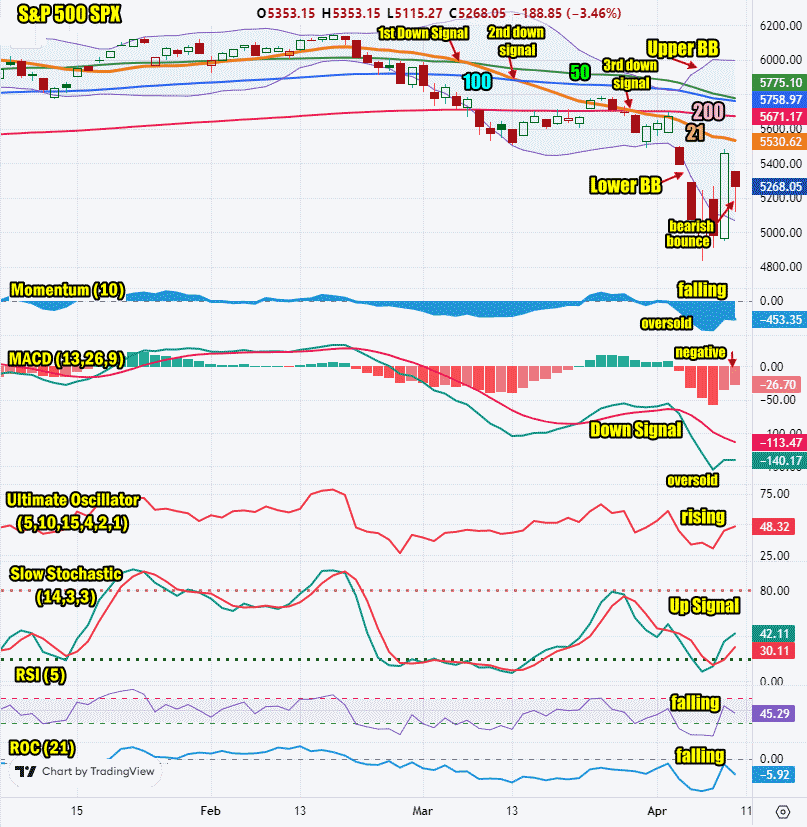
The index closed below the 200 day moving average and below Wednesday’s high which is bearish.
The closing candlestick is bearish but points to a possible bounce as the candlestick has a large shadow.
The 21 day moving average is falling and closed at 5530. The 21 day moving average fell below the 50 day on Friday Mar 7/ It fell below the 100 day on Thursday Mar 13 for a second down signal and on Friday Mar 28 it fell below the 200 day for a third down signal.
The 50 day moving average is falling and closed at 5775 which is bearish. The 50 days in on the verge of falling below the 100 day. This would be another down signal.
The 100 day moving average is falling and closed at 5758 which is bearish.
The 200 day moving average is falling and closed at 5671 which is bearish.
All the moving averages slowed their decline on Thursday but are still quite bearish.
The Lower Bollinger Band is once again falling. The Upper Bollinger Band is trending sideways which is signaling a change is coming to the direction. This is neutral due to Thursday’s lower close.
For Friday the SPX chart is strongly bearish but the closing candlestick points to a possible bounce today. It will be suspect though.

SPX Stock Market Outlook review of Thu Apr 10 2025
Stock Market Outlook: Technical Indicators Review
Momentum: Momentum is falling and negative. It is still very oversold. The reading is extreme at -453. There is room for a further large move higher.
|
MACD Histogram: MACD (Moving Averages Convergence / Divergence) issued a down signal on Thu Apr 3 2025. On Thu Apr 10 2025 the down signal lost some strength.
|
Ultimate Oscillator: The Ultimate Oscillator is rising and negative. It is not oversold.
|
Slow Stochastic: The Slow Stochastic has an up signal in place and is not oversold. It is signaling we should expect a higher day for today.
|
Relative Strength Index: The RSI signal is falling and not oversold.
|
| Rate of Change: The rate of change signal is falling and signaling a lower close for Friday. Settings: Rate Of Change is set for a 21 period. This indicator looks back 21 days and compares price action from the past to the present. With the Rate Of Change, prices are rising when signals are positive. Conversely, prices are falling when signals are negative. As an advance rises, the Rate Of Change signal should also rise higher, otherwise the rally is suspect. A decline should see the Rate Of Change fall into negative signals. The more negative the signals the stronger the decline. |
Stock Market Outlook: Support and Resistance Levels |
| 5800 is resistance |
| 5775 is resistance |
| 5750 is resistance |
| 5730 is resistance |
| 5700 is resistance |
| 5650 is resistance |
| 5630 is resistance |
| 5600 is resistance |
| 5550 is resistance |
| 5500 is resistance |
| 5450 is support |
| 5400 is support |
| 5230 is support |
| 5000 is support |
| 4770 is support |
| 4680 is support |
| 4500 is support |
| 4365 is support |
| 4150 is support |
| 4000 is support |
Stock Market Outlook for Fri Apr 11 2025
Friday morning before markets open we get the start of bank earnings. If they are strong and beat estimates as well as the same quarter last year, this will help stocks move higher, at least in the morning. However if earnings are poor, this will weigh on stocks.
The closing candle4stick is signaling a possible move back higher on Friday but much will depend on bank earnings as well as whether there are further comments on tariffs with China. On Thursday the Consumer Price Index numbers came in lower than estimated, a sign that inflation is not increasing.
Friday should see stocks rally in the morning but we will see dips and they could once again be fairly deep. A higher close is still expected to end the week.
Potential Economic and Political Market Moving Events
Monday:
3:00 Consumer credit is estimated to decline to $15.5 billion from $18.1 billion prior
Tuesday:
6:00 AM NFIB optimism indexcame in lower than estimated at -97.4
Wednesday:
10:00 Wholesale inventories came in as expected at 0.3%
2:00 Fed minutes from March interest rate meeting were a non-event as all interest was on the massive rally.
Thursday:
8:30 Weekly Initial Unemployment Insurance Claims met estimates at 223,000 from 219,000 prior
8:30 Consumer price index dipped 0.1% as estimated
8:30 Consumer Price Index year-over-year came in better than estimated at 2.4% showing inflation is lower
8:30 Core CPI was lower at 0.1%
8:30 Core CPI year-over-year came in at 2.8% below estimates of 3.0%
2:00 Monthly federal budget fell to 1161 billion which was above estimated by a wide margin
Friday:
8:30 Producer Price Index is estimated to rise to 0.2%
8:30 Core PPI is expected to rise to 0.3% from 0.2% prior
8:30 PPI year-over-year is estimated to be unchanged at 3.2%
8:30 Core PPI year-over-year is estimated unchanged at 3.3%
10:00 Consumer sentiment is estimated to dip to 54.6 from 57.0 prior

 Prior Trading Day Summary: