 On Friday the technical indicators before the markets opened pointed to an up day, but not the huge up day that stocks experienced. Stocks jumped particularly due to President Trump’s discussion on rolling back Dodd-Frank regulations which sent bank stocks higher. This led the markets back toward their all-time highs.
S&P Index Close
The S&P index ended the day up 16.57 points to 2297.42, well within reach of the 2300.99 all-time high.
Dow Jones Index Close
The Dow Jones ended up 186.55 points for a gain of 0.94%. It closed at 20,071.46 within reach of the all-time high of 20,125.58.
NASDAQ Index Close
The NASDAQ closed up 30.57 points to end the day at 5666.77 just inches away from the all-time high of 5,669.61.
Stock Market Outlook

Stock Market Outlook review for Feb 3 2017
Chart Comments At The Close:
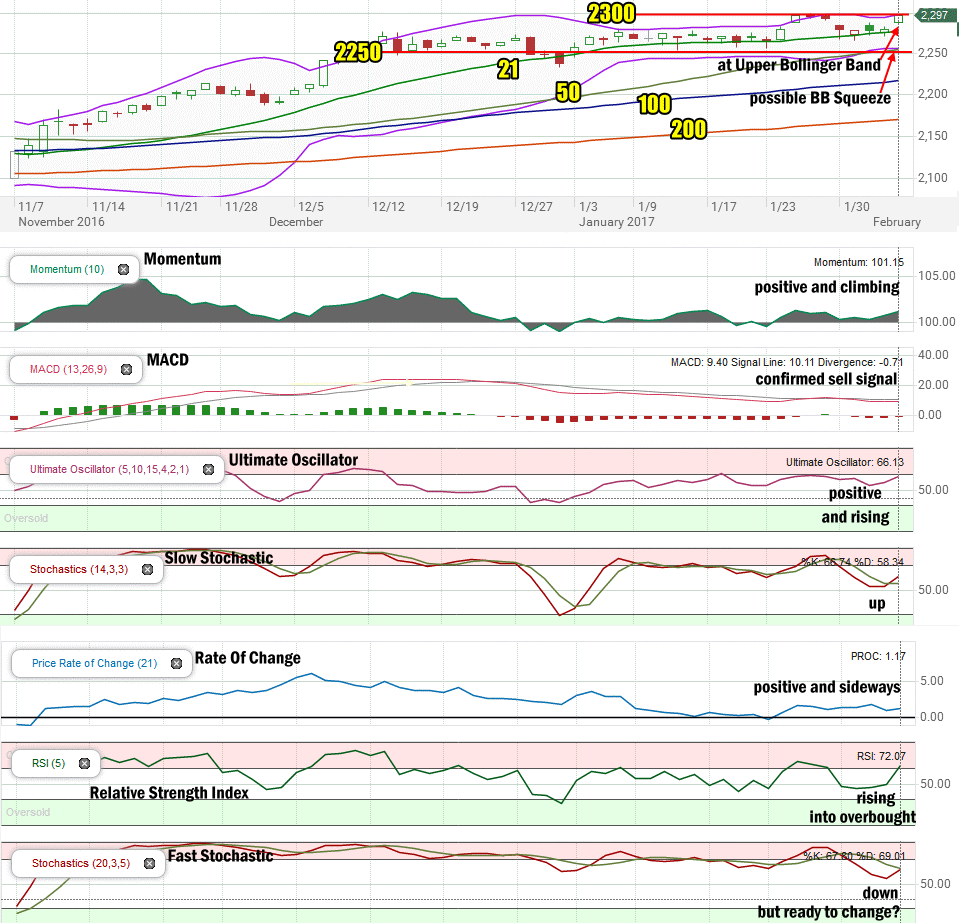
On Friday the S&P jumped to reach the Upper Bollinger Band. This could be about to make a change to the possible Bollinger Bands Squeeze I wrote about earlier this week. If the squeeze ends now, it will be bullish for stocks.
The closing candlestick is bullish for Monday.
The Lower Bollinger Band that had moved above the 50 day moving average which is bearish for the index is on the verge of falling back below the 50 day moving average which would be bullish. The 2260 level continues to hold up well and the S&P closed almost at 2300. All the moving average are continuing to rise.
Stock Market Outlook: Technical Indicators:
Momentum: For momentum I use a 10 period when studying market direction. Momentum is still positive now rising.
MACD Histogram: For MACD Histogram, I am using the Fast Points set at 13, Slow Points at 26 and Smoothing at 9. MACD (Moving Averages Convergence / Divergence) issued a sell signal Jan 30 2017. The sell signal is weak heading into Monday but still in place.
Ultimate Oscillator: The Ultimate Oscillator settings are: Period 1 is 5, Period 2 is 10, Period 3 is 15, Factor 1 is 4, Factor 2 is 2 and Factor 3 is 1. These are not the default settings but are the settings I use with the S&P 500 chart set for 1 to 3 months. The Ultimate Oscillator is positive and back rising.
Slow Stochastic: For the Slow Stochastic I use the K period of 14 and D period of 3. The Slow Stochastic tries to predict the market direction further out than just one day. The Slow Stochastic has an up signal in place.
Rate of Change: Rate Of Change is set for a 21 period. This indicator looks back 21 days and compares price action from the past to the present. The rate of change signal is positive but continues to move sideways which is a bit disappointing for the start of the week.
Relative Strength Index: The relative strength index is set for a period of 5 which gives it 5 days of market movement to monitor. It often is the first indicator to show an overbought or oversold signal. It is rising and into overbought readings.
Fast Stochastic: For the Fast Stochastic I use the K period of 20 and D period of 5. These are not default settings, but settings I use for the 1 to 3 month S&P 500 chart when I have it set for daily views. The Fast Stochastic has a down signal in place but looks to be on the verge of an up signal if the market moves higher on Monday.
Support Levels To Be Aware Of:
The market has been trying to build support at the 2250 level. There is light support at 2195 but better support is at 2180 and then 2150.
Stock Market Outlook for Tomorrow – Monday Feb 6 2017
The technical outlook is more positive and stronger heading into Monday. MACD is still flashing a weak sell signal as is the Fast Stochastic but the Relative Strength Index (RSI) is nearing overbought and the Slow Stochastic has an up signal in place which is a change from Thursday’s down signal.
There are 2 sell signals on the S&P. There are 4 positive signals that are gaining strength and one that stays sideways. A couple are starting to point to the market once again being overbought.
Overall the outlook is good for a positive day on Monday.
However, the big rally on Friday could set the market up for a morning of weakness so be prepared for some possible downside or dips in the morning on Monday.
It is important to understand that the market has become tied to the emotions of Washington and Trump. With the media almost totally fixated on the President and reporting on every single moment, comment and tweet, investors have to be prepared for volatility which could be steep at times. President Trump shows no indication that he plans on changing his governing methods. That means the media will probably continue to feed on every little detail which will cause angst among many citizens.
So for Monday, be prepared for some possible weakness in the morning, but there should be a positive close on the day, however, as explained, there are no indications anything will be changing in Washington or the media soon and that means volatility is bound to occur at times.
One last comment. I greatly enjoyed the Super Bowl game. It was a”nail-biter” to the end. The Patriots win of the Super Bowl sets up the year to be possibly weak according to “legend”. That “legend” for whatever reason actually has a fairly successful rate of around 80% accuracy. It didn’t happen in 2016 however and perhaps this year may be different as well. As well don’t forget that the Santa Claus rally did not produce a “win” in 2016-2017 either. That’s two traditional signals pointing to weakness in 2017. Just something to keep in mind as the year unfolds.
Stay FullyInformed With Email Updates
Market Direction Internal Links
Profiting From Understanding Market Direction (Articles Index)
Understanding Short-Term Signals
Market Direction Portfolio Trades (Members)
Market Direction External Links
IWM ETF Russell 2000 Fund Info
Market Direction SPY ETF 500 Fund Info
