 Monday saw oil futures jump at the open but then give back most of the gains by the end of the day. Still, shares of Exxon Mobile stock (XOM) ended the day up 2.22% to $90.98 and Chevron Stock (CVX) moved up 1.16% to close at $117.15.
Bank shares finally came under some pressure as investors positions themselves ahead of what is expected to be a Fed interest rate announcement on Wednesday. Wells Fargo Stock (WFC)( fell 2.38% to close at $55.78. Morgan Stanley Stock (MS) fell 1.72% to close at $42.98 and Bank of America Stock (BAC) fell 2.08% to close at $22.61.
S&P Index Close
The S&P index ended the day with a loss of 2.57 points to close at 2256.96.
Dow Jones Index
The Dow Jones ended the day with a 39.58 point advance to close at 19,796.43 and leaving the index around 200 points short of 20,000.
NASDAQ Index Close
The NASDAQ fell 0.59% to 5,412.54 down 31.96 points.
Stock Market Outlook
Chart Comments At The Close:
The S&P made another new all-time intraday high on Monday when it reached 2264.03.
It pulled back as the day wore on and closed slightly negative but left behind a mixed neutral candlestick. The index has been trending outside the Upper Bollinger Band which is bullish but also usually a sign of an overbought market. All the major moving averages are continuing to advance. The levels to watch at this time are 2200, which is not support and 2180 which is support. A move below 2200 should send the S&P quickly down to support at 2180.

SPX Dec 12 2016
Support Levels To Be Aware Of:
There is no support at 2200. There is light support at 2195 but better support is at 2180 and then 2150.
Stock Market Outlook: Technical Indicators:

Stock Market Outlook technical review of Dec 12 2016
Momentum: For momentum I use a 10 period when studying market direction. Momentum is continuing to rise and remains strongly positive.
MACD Histogram: For MACD Histogram, I am using the Fast Points set at 13, Slow Points at 26 and Smoothing at 9. MACD (Moving Averages Convergence / Divergence) issued a buy signal on Nov 9. The buy signal had been losing strength a couple of weeks ago but with last week’s rally, it was gain strength again. Today continued that trend.
Ultimate Oscillator: The Ultimate Oscillator settings are: Period 1 is 5, Period 2 is 10, Period 3 is 15, Factor 1 is 4, Factor 2 is 2 and Factor 3 is 1. These are not the default settings but are the settings I use with the S&P 500 chart set for 1 to 3 months. The Ultimate Oscillator is positive and overbought.
Slow Stochastic: For the Slow Stochastic I use the K period of 14 and D period of 3. The Slow Stochastic tries to predict the market direction further out than just one day. The Slow Stochastic is signaling down for stocks and is overbought.
Rate of Change: Rate Of Change is set for a 21 period. This indicator looks back 21 days and compares price action from the past to the present. The rate of change signal is positive but pulling back. The signal though remains strong.
Relative Strength Index: The relative strength index is set for a period of 5 which gives it 5 days of market movement to monitor. It often is the first indicator to show an overbought or oversold signal. It is overbought.
Fast Stochastic: For the Fast Stochastic I use the K period of 20 and D period of 5. These are not default settings but settings I use for the 1 to 3 month S&P 500 chart when I have it set for daily views. The Fast Stochastic is neutral in its outlook for Tuesday and is extremely overbought.
Stock Market Outlook for Tomorrow – Dec 13 2016
The technical indicators are still biased to the upside. There are 6 positive indicators and one indicator that is negative and signaling market direction is lower on Tuesday.
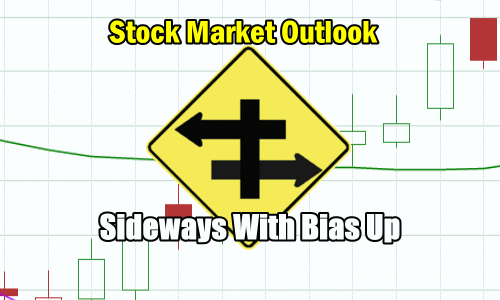
Overall the market may move more sideways on Tuesday ahead of Wednesday’s Fed decision on interest rates. However a move higher ahead of the interest rate decision would not be a surprise and has happened quite often in the past year. However with interest rate worries quite high for a December rate hike, I am expecting more sideways movement rather than up or down on Tuesday.
For Tuesday then, look for the market to move sideways but keep an upward bias.
Stay FullyInformed With Email Updates
Market Direction Internal Links
Profiting From Understanding Market Direction (Articles Index)
Understanding Short-Term Signals
Market Direction Portfolio Trades (Members)
Market Direction External Links
IWM ETF Russell 2000 Fund Info
Market Direction SPY ETF 500 Fund Info
