
Monday saw a slight dip for the S&P, most of which was at the close of the day. It was a tight trading session with the index several times testing the 3500 level. With the NASDAQ up 9.5% in August and the S&P up 7%, August 2020 is one for the history books marking the best August since the 1980’s. Here’s what to watch for as September gets underway.
Stock Market Outlook Chart Comments At The Close on Mon Aug 31 2020
On Monday the closing candlestick is bearish for Tuesday following a second close above 3500. The most important signal in the chart on Monday is the Lower Bollinger Band creeping above the 50 day moving average which is bearish and could signal some days of weakness ahead.
There are still 6 up signals and now two down signal caused when the Lower Bollinger Band moving above the 100 day moving average back on July 27 and today above the 50 day.
The 21, 50, 100 and 200 day moving averages are continuing to climb. The SPX chart is still very bullish.

Stock Market Outlook review of Mon Aug 31 2020
Stock Market Outlook: Technical Indicators Review:
Momentum: Momentum is falling.
- Settings: For momentum I use a 10 period when studying market direction.
MACD Histogram: MACD (Moving Averages Convergence / Divergence) issued an signal on Monday Aug 24. That signal was slightly weaker on Monday.
- Settings: For MACD Histogram, I am using the Fast Points set at 13, Slow Points at 26 and Smoothing at 9.
Ultimate Oscillator: The Ultimate Oscillator is falling.
- Settings: The Ultimate Oscillator settings are: Period 1 is 5, Period 2 is 10, Period 3 is 15, Factor 1 is 4, Factor 2 is 2 and Factor 3 is 1. These are not the default settings but are the settings I use with the S&P 500 chart set for 1 to 3 months.
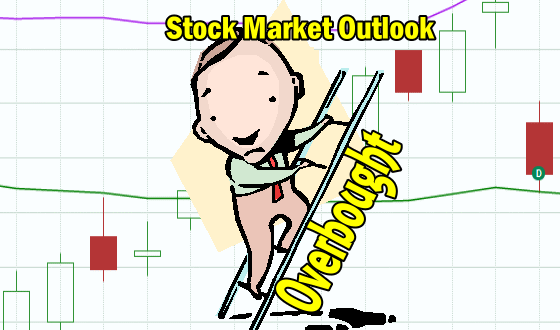
Slow Stochastic: The Slow Stochastic has a down signal in place and is still overbought.
Settings: For the Slow Stochastic I use the K period of 14 and D period of 3. The Slow Stochastic tries to predict the market direction further out than just one day.
Relative Strength Index: The RSI signal is falling and extremely overbought.
- Settings: The relative strength index is set for a period of 5 which gives it 5 days of market movement to monitor. It is often the first indicator to show an overbought or oversold signal.
Rate of Change: The rate of change signal is falling indicating investors shouldn’t expect a lot of changes in prices.
- Settings: Rate Of Change is set for a 21 period. This indicator looks back 21 days and compares price action from the past to the present. With the Rate Of Change, prices are rising when signals are positive. Conversely, prices are falling when signals are negative. As an advance rises the Rate Of Change signal should also rise higher, otherwise the rally is suspect. A decline should see the Rate Of Change fall into negative signals. The more negative the signals the stronger the decline.
Support and Resistance Levels To Be Aware Of:
3500 is resistance
3450 is resistance
3400 is support
3375 is support
3300 is support
3275 is support
3200 is support
3150 is support
3050 is support
3000 is support
2975 is light support
2950 is light support
2900 is light support
Stock Market Outlook for Tomorrow – Tue Sep 1 2020
Note how just a bit of weakness on Monday, turned all the technical indicators lower. Investors should watch for some dips on Tuesday and a potentially lower close. We could see Apple Stock and Tesla stock both dip lower on Tuesday after opening on Monday with their most recent splits.
The Lower Bollinger Band pushed above the 50 day on Monday which also usually signals a few days or some weakness.
Overall investors are still bullish so any dips will find ready buyers. With the Rate Of Change advising that investors shouldn’t expect prices to change by much, dips on Tuesday are opportunities I plan to use for setting up more trades.
Stock Market Outlook Archives
Morning Investing Strategy Notes for Thu Feb 6 2025

Stock Market Outlook for Thu Feb 6 2025 – Choppy Dips Possible But Still Up

Stock Market Outlook for Wed Feb 5 2025 – Choppy With A Lower Close

Morning Investing Strategy Notes for Wed Feb 5 2025
Morning Investing Strategy Notes for Tue Feb 4 2025
Stock Market Outlook for Tue Feb 4 2025 – Possible Bounce But Lower Close

Morning Investing Strategy Notes for Mon Feb 3 2025
Stock Market Outlook for Mon Feb 3 2025 – Lower Close Over Tariff Worries

Morning Investing Strategy Notes for Fri Jan 31 2025
Stock Market Outlook for Fri Jan 31 2025 – Choppy – Dip Possible But Still Up
Morning Investing Strategy Notes for Thu Jan 30 2025
Stock Market Outlook for Thu Jan 30 2025 – Higher Open But Lower Close

Morning Investing Strategy Notes for Wed Jan 29 2025
Stock Market Outlook for Wed Jan 29 2025 – Bullish Even With The Fed

Morning Investing Strategy Notes for Tue Jan 28 2025
Stock Market Outlook for Tue Jan 28 2025 – Bounce Likely

Morning Investing Strategy Notes for Mon Jan 27 2025
Stock Market Outlook for Mon Jan 27 2025 – Overbought – Dips Likely – But Bullish Heading Into More Earnings

Morning Investing Strategy Notes for Fri Jan 24 2025
Stock Market Outlook for Fri Jan 24 2025 – Still Overbought – Choppy – Dips Likely – But Higher
