Today’s SPY PUT SPDR 500 ETF trade was based on yesterday’s market timing indicators which I reported in this article. Since the market direction outlook was down I felt the SPY PUT hedge was certainly worth putting in place. The SPDR 500 ETF also called the SPY is my favorite method of hedging my portfolio. It does requires watching the SPY PUT premiums and the S&P 500 as I use it for daily trades. Only during bear markets do I normally hold my SPY PUTS longer than a day. Therefore when a market direction down signal is given, investors who cannot watch the market daily might want to consider such products as HDGE Active Bear ETF or SDS and a host of other bear type ETFs.
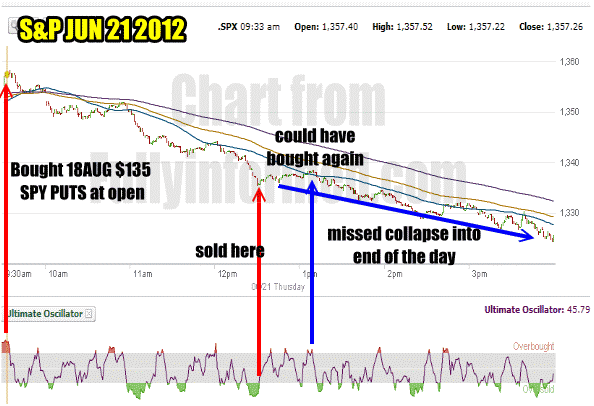
SPDR 50 ETF SPY PUT Chart For June 21 2012
Below is today’s chart of the S&P 500. I am using the 1 minute chart on the SPX below. I bought my 20 SPY PUTS at the open. I was not expecting a major decline but thought the S&P might pull back perhaps 15 points. At 12:30 PM the S&P was down to 1335 from 1357 at the open. This was a drop of 22 points which was more than I expected. The Ultimate Oscillator was signalling extremely oversold. I felt a bounce was probably going to occur and I therefore sold all my SPY PUTS. This was certainly a mistake as the S&P fell another 8 points before closing at 1325.51. In hindsight I should have reviewed a number of my earlier market direction articles in while I have mentioned support being at 1325. I just didn’t think the market could fall to 1325 in one day.
I missed a number of good chances to buy SPY PUT Options after 12:30 PM including a great opportunity around 1:oo PM when the rally failed and the market continued its waterfall decline. I did not expect the decline to be so consistent and certainly not much lower than where I had sold my SPY PUT options at 12:30 PM. It shows it is important to be aware of support levels and realize that stocks can be more irrational than investors realize.

My SPY PUT Trade for June 21 2012 was good but I missed out on a great opportunity.
The most unusual thing about today’s decline was the VIX Index which only rose to 20.08 by the close. It was as if the decline was orderly with low volatility.
SPDR 500 ETF SPY PUT Trade Summary
There is not a lot else to report on this SPY PUT trade. It was simple and non-eventful. I simply followed last night’s market timing call, bought the SPY PUTS at the open, set my goal expecting perhaps 15 points in a decline and used the ultimate oscillator to spot oversold indicators to sell my spy puts. Overall one of the easier spy put options trades this year and probably because the market never actually had much of a rally at all.
I will not be using the SPY PUT options (SPDR 500 ETF) Trade tomorrow (Fri June 22 2012) unless I see a definite sign of a failing rally. I am expecting the S&P 500 to rally and then more selling next week when I will use my SPY Put Trade again.
For those investors who are using HDGE or SDS or other such instruments, you may want to keep an eye on the rally to determine whether to sell your positions for profits from yesterday and then buy back as the rally heads higher, if we in fact have a rally tomorrow.
Investors are disappointed that there are no new FED Funds being pumped into the markets. Today they exited in numbers and the sell signal by Goldman certainly didn’t help long-term investors. You can read my market timing comment for today here. Overall I think the market is heading lower but not before a rally attempt.
Then I will be back to using my SPY PUT trade.
SPY PUT OPTION LINKS
Internal References
Listing Of SPY PUT Trade Articles
Articles Discussing The Ultimate Oscillator
Understanding SPY PUT Hedge Strategy Part 1
(When I Can Watch The Market During The Day)
Understanding SPY PUT Hedge Strategy Part 2
(When I Am Unable To Watch The Market)
Understanding SPY PUT Hedge Strategy Part 3
(Short version using only ultimate oscillator)
External References
SPY PUT Option Chain
SPY ETF Home Page From State Street Global Advisors (SPDR)
