Spy put options has been my method of hedging against losses in my portfolio when market direction changes to down. When the SPDR 500 ETF was first introduced in 1993 I spent much time studying the SPY Puts and SPY Calls trying to determine how I could develop a strategy to protect my entire portfolio from significant losses throughout a year. You can read about my early years in the SPY PUT through this link. I found that the SPY PUT could not work without the help of market timing tools.
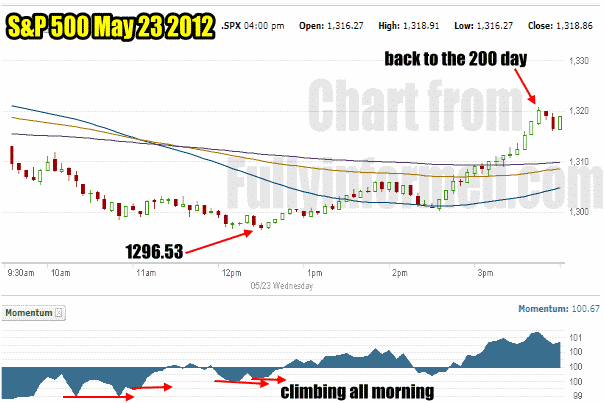
For example, in today’s trade I used momentum to keep an eye on the S&P 500 throughout the day and thanks to the momentum timing tool, I did not stay too long in my SPY PUT trade. Whenever the S&P 500 opens down on big volume I like to bring out the momentum tool to see if there is enough momentum to keep pushing the market lower or whether the selling in the market is overdone. In the case of today’s gap down at the open, momentum showed that all the selling was first thing in the morning. As momentum began to climb back I knew that the market direction would change. I did not know whether it would turn positive, or even how high it might move. But that was not important for the SPY PUT trade. All I needed to know was that the downside in the market was overdone and the likelihood of a much lower move was unlikely. This prepared me to then sell at the first sign of a market direction change.
SPY PUT Options Trade Chart
The first spy put chart I want to show is the day’s trade on the S&P 500 with the momentum tool. You can see in the momentum tool below the deep selling first thing in the morning. I bought my initial SPY PUT options around 10:00 AM when the market had its first bounce. After 10:00 AM, you can see how momentum kept setting new higher lows. This told me that I should exit the market sooner rather than later as it appeared the market direction would not fall lower than what it did at noon.

SPY PUT Trade Chart and Momentum Indicator
Spy Put Trade Chart With Ultimate Oscillator
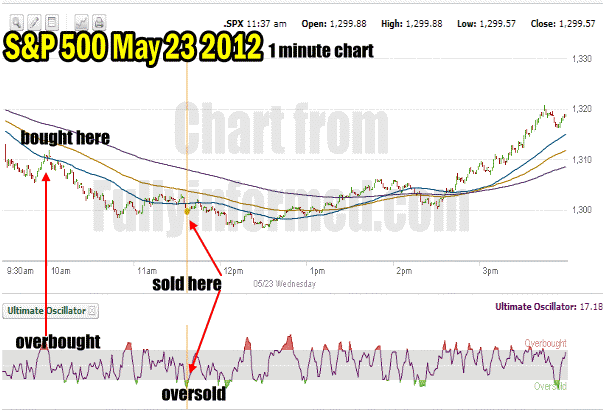
The second chart I want to review is the Ultimate Oscillator tool with the SPY PUT Chart. Today had to be one of the easiest SPY PUT trades I have done this year.
At 10:00 AM with the market bouncing back, the ultimate oscillator flashed a very clear overbought indication. I bought 30 SPY PUT options contracts. With the selling so heavy out of the gate and with European stock markets tumbling I was convinced that the S&P 500 would fall lower.

Spy Put Options Chart For May 23 2012 Day Trade
I used the momentum indicator from the first chart, to watch the momentum in the overall S&P 500. I could tell by 11:00 AM that the market direction was going to stall out at some point because momentum was rising as selling was slowing in stocks.
The first couple of oversold indications I chose to ignore but by 11:30 AM with a strong oversold indication in the ultimate oscillator I sold my spy put contracts.
Spy Put Trade SPDR 500 ETF Summary
Today’s spy put trade was easy but without the momentum indicator, I might have ventured back into the S&P in the afternoon, which would have resulted in a serious mistake as the market rose into the close. I thought today’s spy put trade was worth mentioning as it shows that while I primarily use the ultimate oscillator for my day trading of the spy put options, it is valuable to always remember the other market tools that can be used to assist in staying on the right side of the market when engaged in my spy put trade.
