SPY PUT Double dip days are uncommon events. They occur in bear markets, not bull. The bear market that has been with us since May 2011 is now into its 7th month. Thanks to the bear market, my SPY PUT hedge has added significantly to my profit. Almost 50% of the profit earned in my US Portfolio is from my SPY PUT trades. As explained on the weekend, I purchased spy puts on Friday just before 2:00 PM to hold over the weekend for protection.
This morning shortly after the open I sold my spy puts at $7.37 and in the early afternoon I was able to buy spy put contracts again and sell them in the same day. The SPY PUT trade remains my hedge choice and I have received many emails from readers who are paper trading and tweaking their own SPY PUT and Powershares strategies for hedging their portfolios. For those interested, you can choose this SPY PUT link to read more about this SPYDER ETF.
SPY PUT Trade commenced on Friday
On Friday I purchased the 21JAN12 SPY PUT $122 strike for $5.91. As explained in my weekend SPY Put update, investors need to ask themselves what is going to drive this market back up. The key to understanding the market right now is knowing the political and financial environment we are in. In my opinion, until the European Governments accept that they have no choice but to turn on the printing presses and print Euros, this debt crisis is only going to get worse. Therefore in this environment how is the market going to reclaim the April and May highs? The direction is presently down.
Confident in my direction call, I purchased puts on Friday later in the afternoon to prepare for the beginning of the week. I believed that whether Monday moved higher, really did not matter. The trend right now is down. Therefore as an investor I should prepare for a possible larger downturn in the markets.
The First SPY PUT Trade
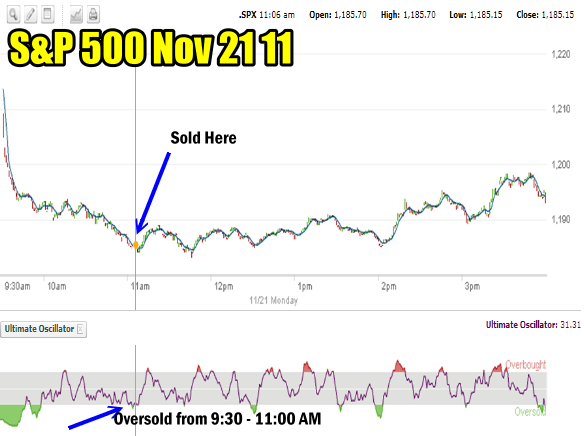
With the big gap down in the morning, the ultimate oscillator showed the S&P to be immediately oversold. This is natural with so large a gap down to start the day. That oversold indicator should be ignored and I waited for further signals. Around 10:30 AM MACD (Moving Average Convergence / Divergence) began to climb back from strong negative readings. By 11:00 AM it was almost positive and I sold my spy put contracts for $7.52. This marked a return of 27%.

S&P500 1 minute chart with the Ultimate Oscillator
USING MACD WITH THE SPY PUT
MACD can be a great technical tool for day trading. In the chart below you can see how MACD was indicating that the selling was waning. MACD turned back up at 9:30AM. Despite the market continuing to sell lower, MACD did not support the move lower. Normally when MACD does not support the move lower in the market, it is indicating that the selling is overdone and the market lows will hold for the time being.
MACD is a tool I used often in 2008 for those big down days, to tell me when the selling was slowing despite the market continuing to move lower. Unless MACD continues to decline, any selling is normally drawing to a close and any move lower in the markets will usually be reversed some time during the day, such as we saw today.

MACD turned back up around 9:30 AM despite the market continuing to sell lower
Today I waited as the market continued to sell lower and watch the MACD indicator. By 11:00 AM despite the market moving lower, MACD was down just -0.17 while earlier in the morning it has been below -2.00. I sold my 20 spy put contracts based on the Ultimate Oscillator and MACD, which were telling me that the market was regaining composure, the selling was slowing and the low for the day had perhaps been put in.
The SPY PUT Double Dip
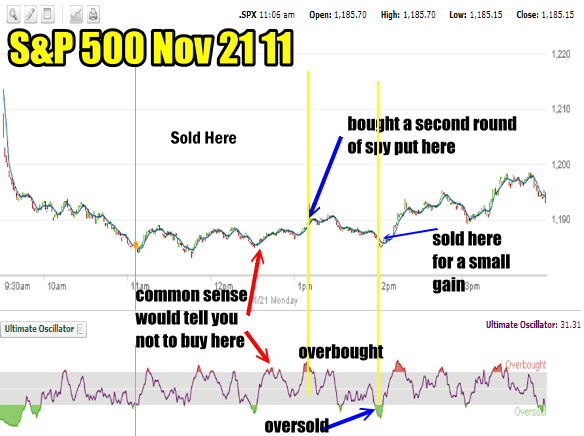
In the afternoon, around 1PM, the S&P managed to climb higher and the overbought indicator showed up again. I purchased 10 spy put contracts and sold them about an hour later when the oversold indicator in the ultimate oscillator showed that selling had reached a climax for that period.
It is important when using the ultimate oscillator for day trading that investors also use common sense. After I sold my first set of puts in the morning the market rose and fell which created a number of overbought indicators which an investor might have considered purchasing spy put contracts against. But common sense should prevail because the market was failing to make new lows and by buying SPY PUT Contracts as per the red arrows in the S&P chart below would mean I would be buying the second set of SPY PUT contracts basically around the price I had sold the original set for.
As well MACD which you can see in the chart above, did not reflect the market was in any kind of heavier selling mode. Therefore common sense dictates that this is not the price to buy spy puts once again and I should wait for the market to move higher or MACD to reflect heavier selling.
Later in the afternoon as the market rose higher, it was well worth buying spy put contracts again as the overbought indicator showed in the ultimate oscillator and the market had moved higher. Again though common sense told me that it would be wise to only buy a small quantity of spy put contracts this second time, since the market had not sold off any lower than in the morning. This could easily mean that the market may sell off again the afternoon but possibly not any lower than had been seen in the morning.

SPY PUT Double Dip on Monday as I purchased and sold spy put contracts a second time
This ability to do a double dip through using the ultimate oscillator and with the help of MACD, is not common, even in a bear market, but when the opportunity arises to double dip with my SPY PUT hedge, I am always glad to be in front of my trading computer to take advantage of it.
I realize that a lot of investors feel technical trading just doesn’t work. However I will keep posting my SPY PUT trades to inform readers that for some investors technical trading does work and for those opened minded investors, they might want to consider paper trading a few strategies for a while to see what kind of results they receive, whether through using SPY PUT contracts or a different investment product.
