RATE OF CHANGE or ROC for short, is a technical timing momentum oscillator indicator used to predict the underlying trend in a stock market, individual stock, ETF or other financial assets. Many investors do not use or understand the Rate Of Change indicator. This simple tool is quite valuable for any period of investing from a few days to weeks to months or a year.
Rate Of Change Definition
The RATE OF CHANGE indicator measures the speed at which prices are changing over a specified time period to determine the direction of the underlying asset. Using the Rate Of Change indicator an investor can for example follow a rising stock through watching the rate of change indicator readings. As well the Rate Of Change indicator can be used to determine when to stay in a stock market index and when to leave. The Rate Of Change indicator is also very adept at spotting oversold and overbought conditions.
The rate of change can be set for any specified time period. I usually use 20 period but I change it often depending on the trend I am following. It could be used for day trading by selecting a period of say 1 minute on the SPX and setting the Rate Of Change To 5 or 10 to reflect 5 minutes or 10 minutes. I have never used it for day trading but I would imagine it could be set up properly to be profitable.
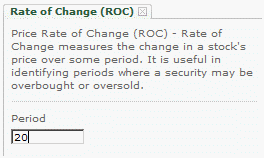
Rate Of Change Indicator Settings
Rate Of Change Calculation
The calculation or formula used is simple. RATE OF CHANGE = [(Close – Close n periods ago) / (Close n periods ago)] * 100
Rate Of Change Measuring OverSold and Overbought
The Rate Of Change Indicator measures based around a 0 (zero) setting. When above zero the movement is positive and below zero it is negative. As it climbs and reaches higher levels or lower levels it signalled oversold or overbought.
For example with a setting of 20 the November 2008 market collapse brings out a reading of negative 39.89. This is an extreme oversold indication. Whether or not an investor wants to buy because of this extreme reading is a personal choice. However anything below the zero line is negative.
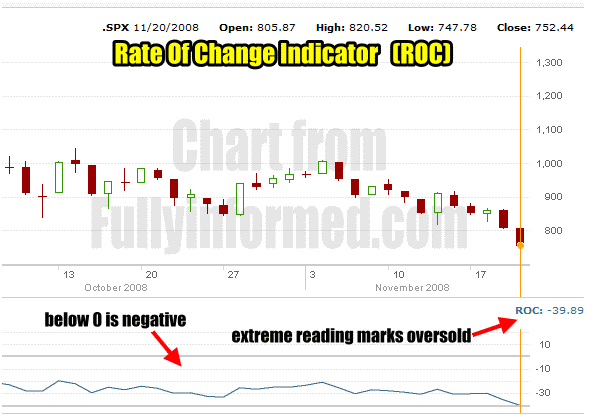
Rate Of Change Indicator In The November 2008 Market Collapse
Therefore as the underlying asset rises from an oversold indication, it does not necessarily move above the zero indication until the momentum is actually positive. In the example below you can see how the rise in November in December 2008 after the market sold off in November did not result in the indicator moving positive or back above the zero line. Basically as it rose it was still indicating momentum was still negative in the market despite the rise. This can often save an investor from stepping into a market that appears ready to rise when in fact it is a “dead cat bounce”.
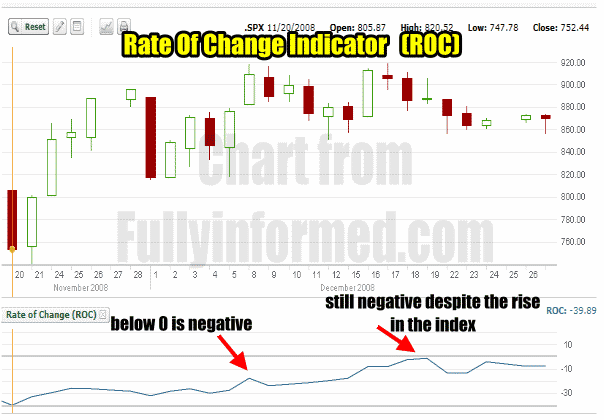
The Rate Of Change Indicator remains negative despite the rise in the SPX
The same happens above the zero line. In the example below the Rate Of Change indicator is following the rise in Microsoft Stock. On December 15 2011 the indicator moved above the zero line going positive on Microsoft Stock. An investor could have bought Microsoft Stock on this day. As the stock rose the Rate Of Change rose with the stock until Jan 23 2012 when the Rate Of Change gave a high reading of 15.19. Note from that point forward the indicator fell but the stock continued to rise. As long as the Rate Of Change stayed positive the investor would stay with Microsoft Stock as it rose. It did not matter that the Rate of Change was falling. The fall in the indicator reflects the momentum in the stock as it was slowing during the ascent. As the stock started to experience trouble the rate of change headed towards the zero line. When it turned negative the stock too fell. An investor would follow the rate of change and as the stock pulled back, he would check the rate of change and see that it is moving closer to the zero line. That could be used as a signal to sell his shares. I often use this signal to time selling covered calls.
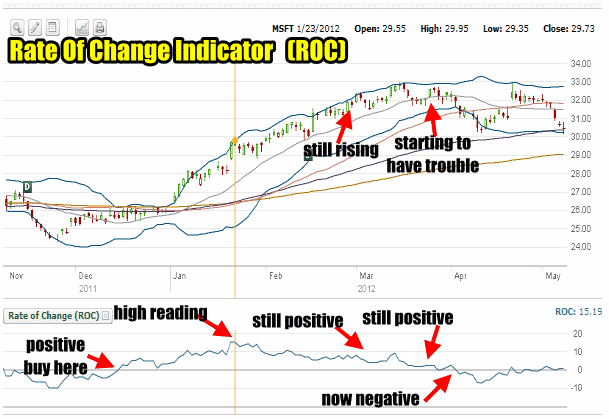
Rate Of Change Indicator following the rise in Microsoft Stock in early 2012
Rate Of Change Indicator General Use
You can see from the above examples the value of this pure momentum indicator. Due to this the indicator can be used for longer term investing. For example the Rate Of Change set at a 20 period and laid out over a yearly chart would have told an investor to get out of the stock market on Dec 31 2007 and re-enter the market on Sept 14 2009. This would have avoided the entire 2008 to 2009 bear market.
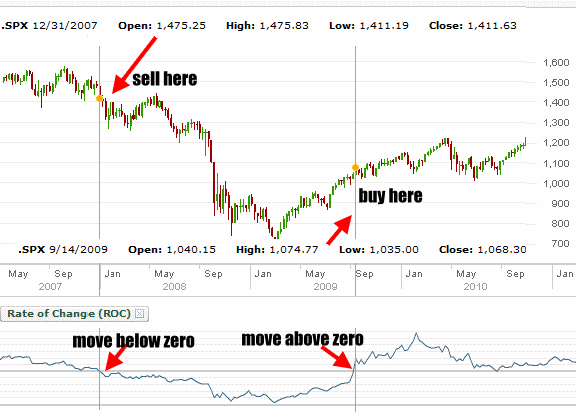
Rate Of Change Indicator Can Assist In Missing Market Collapses and Extremes
Rate Of Change Indicator Conclusion
It is easy then to see how the Rate Of Change Indicator can be used for a variety of technical analysis and purposes. It should, like all technical tools be used in combination with other tools which can confirm what the Rate Of Change indicator is signaling.

