Put Selling against stocks is a trade that adds small profits to a portfolio. When I am Put Selling against a stock I am earning small amounts. These can be as small as .20 cents. Therefore to get the most value for placing my capital at risk through Put Selling, it is important to pick the right stocks and have conviction or confidence in those stocks. Many investors sell puts against stocks they would not want to own, no matter what the circumstances. There is nothing wrong with that strategy and indeed there is a lot to like about it. But this does not mean an investor should simply look at a chart and decide if a chart looks good or bad. Instead the investor should also look at the company, its earnings potential and the technical indicators to determine the support areas within the stock and sell at or below those levels.
Put Selling Against Support
When an investor who does not want to own shares starts Put Selling, it is important to pick support levels and sell around those levels. This gives the investor an edge as even if the stock should fall, there is a good chance it will bounce back to those support levels and they can get out. For an investor such as myself who would own the stock, it still makes sense to sell at or below support levels to try to avoid being assigned shares for as long as possible. This is because I want to engage in Put Selling and compound my profits as quickly as possible before committing my capital to the underlying stock. Through Put Selling I can earn a lot of income and then accept assigned and sell covered calls to get out of the stock. By Put Selling at support I am stacking the odds in my favor that I will have my naked puts expire and be able to continue Put Selling for a while longer to earn additional income.
But what is the best and quickest way to determine support levels that are worth Put Selling against?
Yum Stock and Put Selling Support
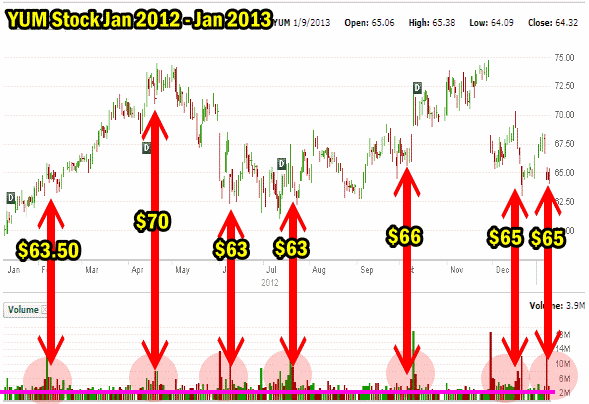
Yesterday I was busy Put Selling YUM Stock. My put strike choices for Put Selling though are not just picked from looking at the options valuations being paid. They are based on a simple format of looking at above average volume levels and matching those with strike points. For example, below is the YUM Stock chart for the past 1 year.
Throughout 2012 I have was Put Selling, but always at or below support. You can see how often YUM stock has been around the $63.00 to $65 level throughout the year. You can see in the chart below where I have marked red circles to indicate the increase in volumes at those levels. Volumes increase because investors and traders know that there is a lot of support at those valuation levels in YUM Stock. These same investors therefore buy at those levels which creates even more support. They are buying there because they believe the stock will move higher and they will cash out for decent profits when that happens.
In April 2012 YUM Stock moved above $70 and volume picked up. The volume is not as high as many of the other high volume periods, but there was enough buying and selling to create weak support at $70.00. But when a support level breaks down, it rapidly turns into resistance, because investors who bought at that support level want out and when the stock moves back to that support level, they sell as quickly as they can to get out of their shares fearing the stock will fall once more and no investor wants to hold a stock they perceive as being overvalued.
If you look at the second period when the stock moved above $70.00 in November of the same year, you can see the volume levels which rather than spiking up stayed around average. This is because investors were no longer buying that rally and the other investors who previously bought stock above $70.00 were selling to get out of the stock.
Based on the YUM Stock chart below you can see why for 2012 I was Put Selling almost predominantly the $62.50 naked puts. Select this link to review the 2012 Trades for Yum Stock. The $62.50 put strike was ideal for Put Selling and was consistently below support at $63.00.
By simply glancing at the YUM Stock chart below I can tell that:
1) There is a lot of support at $63.00. This means if the stock falls back to $64.00 it is time to do Put Selling at the $62.50 level which I did on Tuesday when YUM Stock fell on the news that earnings out of China would be impacted about 6% rather than the expected 4%. I also know that if the stock falls below $64.00 it is time to buy stock and use the Bollinger Bands Strategy Trade to profit from a bounce back in the stock.
2) There is some support at $65 which was tested twice during the year but did not hold. With YUM Stock now trading below $65.00, the $65 valuation level becomes resistance. I therefore know that if YUM Stock gets back above $65.00, I need to wait before Put Selling at $65.00, to be certain that the $65.00 level is true support in the stock.
3) There is very little support at $66.00 and even less support at $70.00 so unless I want to own shares at these levels I should stay clear of Put Selling those strikes or near those levels as true support is down around $63.00.

YUM Stock Support and Resistance
Once I look at a chart like the YUM Stock above I know that there is very little support above $63.00 even though the stock has spent much of the year above $63.00. This is a warning that I should be careful when selling puts above $63.00. At the same time, the chart above tells me that on every single dip back to below $65.00, it is worth Put Selling the stock. Pretty simple isn’t it.
Put Setting Support and Resistance Levels in Yum Stock Summary
I like to keep things as simple as possible. Many investors feel that to understand support and resistance they need a variety of tools and complicated mathematical formulas. I have tried all kinds of different methods including Fibonacci. What I found was that most of the time I did not get the higher premiums because I was waiting too long before entering my Put Selling trades. For example, often Fibonacci would advise that the stock was going to fall further and I would wait and wait and in the end never sell puts.
A good example would be Intel Stock this past fall. Fibonacci charting showed that the stock would fall to around $18.60 to $18.75. This meant wait and sell the $18 put. Well the stock never made it that low and instead I engaged in Put Selling the $21, $20 and $19 put strikes, based on my own volume chart as per above that picked those levels as having support. Today Intel stock is trading at $21.25, above the three support levels that volume signaled had good support.
YUM Stock is no different. The volume charting above shows where the majority of investors are holding YUM Stock, based on the large volume of shares at that level. With the majority of investors around the $63.00 level, that’s where strong support lies.
Therefore by put selling the $62.50 naked puts, I have a very good chance the puts will expire out of the money. At the same time, should the $63.00 level break for whatever reason, I know I have a good chance YUM Stock will bounce around and I will probably be able to sell covered calls at $62.50 and either work my cost basis in YUM Stock lower, or be exercised out of the stock.
This simple charting technique has served me well for better than 30 years and assisted my Put Selling even back in the 1970’s when almost all Put Selling was done over the counter and not through the regular markets.

