PUT SELLING is an intriguing strategy that has grown in popularity over the past few years. Put selling is a strategy of selecting a stock, checking put option premiums at various strikes and determine if those put option premiums are high enough to warrant selling the puts. If the stock stays above the put strike sold by the time the option expires, then the put seller keeps all the put option premium earned when the put was sold. If the underlying stock should fall below the put strike sold by options expiry then the put seller either can buy back the put and establish a new put position or take his loss or he can accept assignment of the shares in the stock which he had sold puts against. It is a simple strategy.
There are of course lots of little tweaks, alterations or adjustments which can be made along the way, but put selling is a simple strategy. Market Timing is the use of both technical market indicators, which I have referred to often in my website and which there are numerous tools available, and fundamental analysis, to determine the direction of the stock market.
Having some idea of Market Direction is paramount to successful long-term investing. Through using market timing indicators the investor attempts to predict the overall market direction to earn profit and income while protecting himself from a downturn which could see him holding stocks that higher valuations than where those same stocks could end up in the event that the market turns down.
Why Use Market Timing
Market timing is important to assist in NOT being on the wrong side of the market for downturns. In other words it is far better to be prepared for the market to pull back and NOT have it pull back, then to think the market is moving HIGHER only to find that it moves LOWER.
Market timing indicators then are used not so much to profit from market direction changes as to protect from making the wrong decision about the market direction and have my portfolio severely impacted because of a wrong decision.
If my market timing indicators are telling me that the market direction is probably lower, this is not telling me that I should jump in and buy puts or Ultra Bear funds or any number of products to try to benefit from the drop in stocks. Instead when market timing indicators are telling me that the market direction is probably lower, I can then be prepared in the event that the market does fall AND I am not surprised by it.
Put Selling and Its Relation To Market Timing
Market timing then is relation to put selling is much easier to understand. When I am selling puts on a stock, even one that I would own, I do not want to sell puts for .27 cents that may be worth .75 cents within a day when the market is pulling back. In the same way when I am selling puts against a stock, at the money and the stock then proceeds to fall 5% or 10% lower because the market direction is down, I would rather have sold puts on that stock after it fell 5% or 10%. This is only natural and obvious.
Market timing is what I use to help me SELL PUTS for the best premium I think I can get at the time. BUT if market timing is warning me that stocks could fall lower, then I use that market timing knowledge to hold off on put selling or perhaps sell smaller contract sizes to benefit from the market direction move lower.
In the same way, if market timing signals that the market direction is moving lower and I only sell a few puts on stocks because I believe my market timing indicators AND they end up being wrong, and the market moves higher, I have still benefited from the market timing indicators. They were wrong, BUT because I am put selling for income, I am still generating income, even though I am not doing as many put contracts as I would like, BUT I have not been caught holding large volumes of put contracts when the market really pulls back and I have no capital available to do any more put selling because I have used all my capital without check on what market timing is signalling.
Market Timing Keeps My Put Selling On The Right Side Of The Market Direction
Basically then to summarize, because of market timing, I am almost always on the right side of the market direction. This does not mean I am always ready for the market direction to spike up, BUT I am ready in case the market direction does move lower. If my market timing indicators show that the market direction is up and continues up, then each day I can continue put selling against my favorite stocks since they are moving higher. When the stock moves higher, the chance of my sold put contracts being assigned is lower, because stocks are rising. BUT when the market timing indicators tell me that the market direction is changing or moving lower, I can stop put selling, or even close any profitable puts already sold and wait for a clearer indication of market direction before committing any more capital.
When it becomes clear that the market direction is lower, I can contemplate put selling again, only at lower strikes which again decreases the likelihood of assignment AND will earn higher premiums for the lower strikes as stocks fall and volatility increases.
My Strategy Is Put Selling
It is important to understand that my overall investment strategy is put selling. I am constantly using a selling puts strategy on the stocks I follow. It is essential that I have some concept about what direction the market is moving to protect against a drop in stocks which could assign my put contracts at high strike levels for smaller premiums, when the actual market direction is down which within a day or two could see much higher put premiums at lower strike levels.
The concept behind put selling is to earn as large a put premium as possible while avoiding assignment at high valuations in a stock. To sell put options without any market timing indicators of market direction is basically put selling blindly and hoping everything works out. If an investor has no knowledge of possible market direction then there really is no selling puts strategy even being used. It is all hit and miss. This will not create consistent put selling profits.
Put selling as I have mentioned numerous times, is a strategy that earns small premiums with each trade. It is those small premiums that add up over a large time period to generate decent returns and compound capital. If for example I was to sell put options for .25 cents AND end up buying to close the same puts for $1.00 or more, then obviously this would severely impact my overall return and the compounding effect of my money would be hampered.
Example Of Put Selling WITHOUT Market Timing from 2008
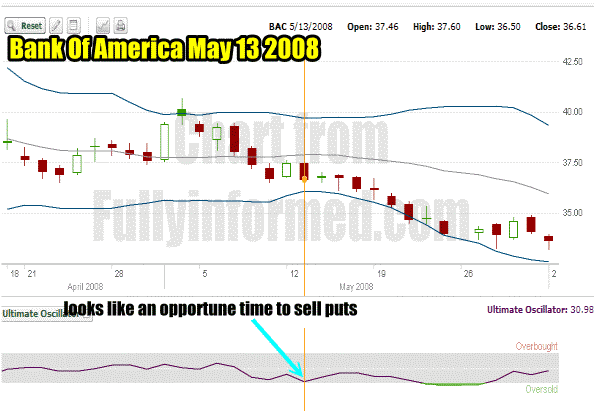
For example if an investor did not use market timing indicators in May 2008 when the market was already starting to fall, he would have committed his capital to stocks. Perhaps one such stock might have been Bank Of America, which was a heavily traded option stock. I had many friends trading BAC in 2005 through to 2008 that got caught holding puts as it plummeted.
Looking at the chart on May 13 it looked like a promising put selling trade. BAC Stock had fallen and if you look at the ultimate oscillator chart which I have included, it is flashing oversold, so many investors would think a bounce was in order. However as you can see from the chart there was no bounce but instead the stock fell 8.2% from $36.61 to $33.58 by June 2 and kept falling.
How could an investor have protected himself from committing his capital from put selling at this point in the market?

Bank Of America put selling on May 13 2008
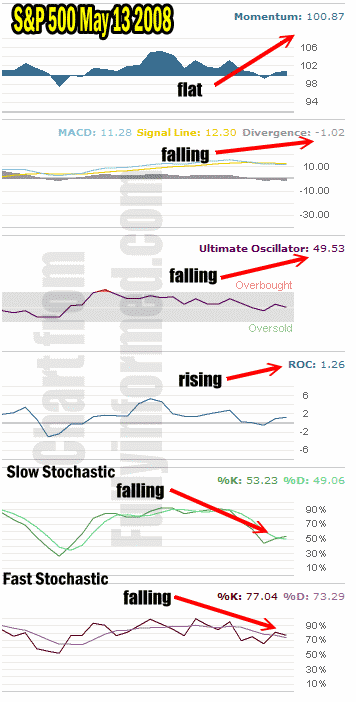
Through checking his market timing technical indicators. Below is my chart from May 13 2008. I wrote at that time:
“With momentum basically flat and only rate of change showing positive, the remaining market timing technical indicators are signalling market direction is lower. With the Ultimate Oscillator reading just 49.53 there is considerably room for this market to fall further.”

Market Timing chart showing Market Direction lower on May 13 2008
If the investor had checked market timing technical indicators on May 13 2008 and still wanted to sell put options on Bank Of America, he could have taken a small position, perhaps selling just 5 put contracts. Within a few short trading sessions he would have either realized his mistake and bought and closed them, or he could have rolled them lower BUT he would not have committed any further capital until the market had calmed down.
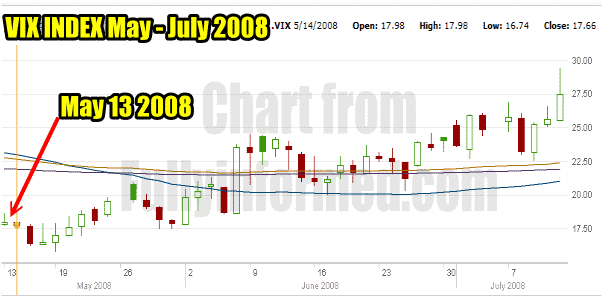
If you look at the VIX chart below you can see that May 13 2008 was near the low-end of volatility as the market waterfall was only just getting seriously underway. But even if the investor was stuck holding his puts from May 13, he would have committed very little capital and kept the majority of his cash available for what ended up being an incredible profit-making ride lower as the market literally fell apart by October 2008.

VIX Index Showing Increased volatility After May 13 2008
Put Selling With Market Timing And Market Direction Conclusion
To conclude, market timing is an important aspect for put selling because it assists in determining market direction to protect the put seller from committing his capital at the WRONG time. While it will never be perfect, market timing has protected me from more misfortune than I can remember and when it predicts that market direction is down and it is wrong, I never worry because I know that I did not get caught committing all my capital to put selling when in fact I might have earned much better premiums and at lower strikes if it had been correct in its prediction of market direction.
