Put selling can provide both profit and income. But when the trade ends up with naked puts deep in the money many investors believe they will be assigned as the stock falls deeper, but this is not always the case. Years ago I found that by using a put selling rolling strategy I could stay away from assignment for literally years. The put selling rolling strategy that I use encompasses two key aspects.
If my sold put contracts are deep in the money, I roll early and a long way out, sometimes 4 to 12 months. The second aspect is that I reduce the number of put contracts when I roll my sold puts further out in time. If I can reduce the number of put contracts and roll down, all the better but if rolling down means I cannot reduce the number of put contracts on the roll, then I remain at the same strike and concentrate on reducing the number of put contracts.
By reducing the number of put contracts with each roll I am freeing up committed capital and reducing the amount of capital I have at risk. Through using this put selling strategy of successfully rolling puts out and down or simply further out in time not only can I control when to accept stock assignment but the capital that is released with each subsequent roll is used to continue put selling but at lower strikes or to purchase stock at fire-sale prices for the inevitable recovery.
This Put Selling Rolling Strategy Addresses The Problem Of Being 100 Percent Invested
This is an excellent strategy for those investors who are always using 100 percent of their capital. There is nothing worse than being fully invested and caught in a severe bear downturn. Many investors watch in dismay as not only their put contracts fall deep in the money as stocks slide, but they wish they could be put selling at lower prices or be buying stock at bargain basement prices, however their available capital is tied to put contracts that were sold at higher valuations. The put selling rolling strategy in this article addresses this problem and gives the investor back some of their capital so they can take advantage of the high volatility, rising put option prices and fire-sale stock prices.
Recently I wrote an article on Put Selling using Johnson and Johnson stock from the 2002 bear market as an example. This was in response to readers’ questions about handling puts that fall deep in the money. In this article I want to look at a more severe downturn in what is arguable a great company, Illinois Tool Works. Stock symbol is ITW. For interested readers who would like to learn more about Illinois Tool Works, select this put selling link to go to ITW Stock investor relations.
Put Selling And The Bear
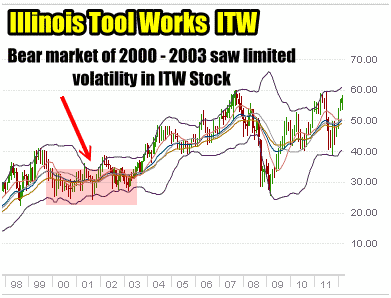
ITW Stock is interesting because in the bear market of 2000 to 2003 the stock did not fall as badly as it did in the bear market of 2008 to 2009 when ITW Stock lost 54% of its value in a matter of months as it was pummelled by sellers. The 2008 to 2009 collapse caught me completely by surprise because the historic patterns which I discussed in the JNJ Stock article, indicated that ITW Stock holds up well in bear markets. This goes to show that you need a strategy that you can rely on for different types of markets because while historic patterns are important, you just never know what the next bear might throw at you. By having tested strategies available an investor can toss emotion aside and apply his put selling strategies successfully to assist in recovering from a stock’s collapse.

Put Selling against ITW Stock was easy in the 2000 to 2003 bear market.
Put Selling ITW Stock In 2008 Bear
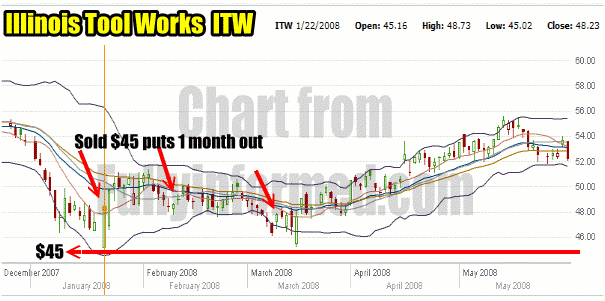
In January 2008 I was put selling the ITW Stock $45 strike (see chart below). My support and resistance charts from 2007 had shown me that there was plenty of support around the $45.00 level. I sold naked puts at the $45.00 strike one month out in February, March and April 2008. With the higher volatility in the overall market, ITW Stock puts premiums were very good and I was averaging over 2% a month with each put selling group of contracts I did.

Put Selling ITW Stock in February to April 2008
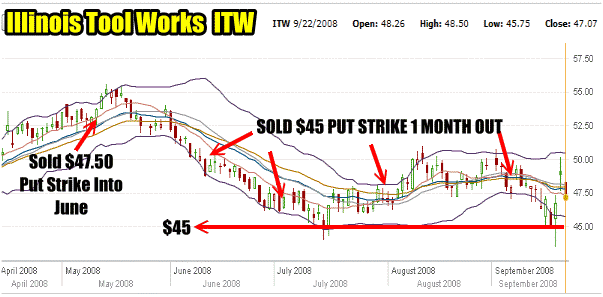
In May 2008 the stock recovered somewhat and I ended up selling the June $47.50 put for around 1%. Luckily for me, my put selling held on into June and the June $47.50 puts expired. (see chart below)
From July until September I continued selling the $45 strike puts often for more than 3% in a month as volatility continued to climb. Because in the 2000 to 2003 bear market ITW Stock had held on and did not fall by much I was unconcerned about all the talk about Lehman Brothers as August rolled around. (see chart below)

Put Selling Illinois Tool Works Stock May to September 2008
The Put Selling Mistake Of September 2008
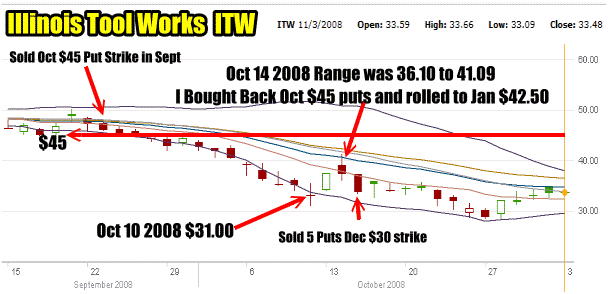
On September 18 the stock rebounded for a short sell off and I did more put selling for October 2008 expiry at the $45 strike. I sold 20 put contracts. (see chart below). Within a few days ITW Stock was already declining and placing my puts slightly in the money. But by the beginning of October 2008 my sold puts were deep in the money.
By October 10 2008 ITW Stock had fallen to 31.00 and my $45 strike was trading for $15.10 to close. This was a ridiculous amount with so few days left until options expiry but with the market whipsawing every day and the VIX climbing to 80 and every doom sayer filling airwaves everywhere with the end of America story, the market makers jacked up all premiums as panic and fear was spreading. The 2008 to 2009 bear market was different from previous bears in that the belief was that the credit crisis was going to destroy banking, housing and inter-country lending. It was a scary time and the market makers were as scared as everyone else so they fluctuated rates around constantly and throughout the day. (see chart below)

Put Selling ITW Stock From Sept to Dec 2008. The first roll took place on Oct 14. I rolled the put contracts from October $45 to January 2009 at $42.50. I reduced the number of contracts by 2 and broke even on the roll down and out.
The First Put Selling Roll From Oct 2008 to Jan 2009
On October 14 ITW Stock rose up to $41.09 from $36.10 before crashing back to close at $37.27. I bought back my 20 Oct $45.00 put contracts for $7.75.
In the past my put selling strategy for puts caught in a market collapse has always been the roll out and down and reduce the number of contracts sold.
On October 14 after buying back my 20 Oct $45.00 put contracts I sold 18 put contracts for January 2009 at the $42.50strike for $8.65.
Total cost to buy back my October $45.00 puts was $15,532.00 with commission. Total income earned by rolling 18 put contracts into January at $42.50 was $15538.00. Effectively I broke-even but was now at the $42.50 strike which my previous historic charts on ITW Stock indicated was below a lot of support.
The following day the stock fell further and I sold 5 puts for December $30 strike for $2.55. This represented a return of 8.5% for two months. I felt it was a safe bet that ITW Stock would not fall much below $30 if at all.
Confidence That The World Will Not End Is Important
This is the type of confidence an investor needs if they are doing put selling in any stock market. An investor must be confident that the world is not ending and that the United States is not going the way of Rome as so many articles predict. If an investor is fearful as panic builds in the market they will always exit at the wrong time. It is paramount for investors to understand that every collapse in equity values has been met with doom and gloom. In 1987 when the market crashed 25% in one day Time magazine ran a cover story “Death Of Equities”. In bear markets are opportunities that provide huge premiums due to the volatility and they are why I keep 30% of my portfolio in cash. I could tell in late October that I was probably going to start committing my capital shortly to a variety of stocks that were on my radar.
The December options expiry found ITW Stock trading above $30.00. With the $30.00 strike expired I continued put selling ITW Stock. After December options expiry I sold 5 put contracts for Feb $30.00 for $1.95. Volatility had fallen a lot since October and November and option premiums reflected this.
Put Selling Rolling Strategy Continued In Part 2
Part 2 of this article on put selling rolling strategy and ITW Stock continues with more put rolling and more put selling as the stock collapsed going into 2009. Read Part 2 of Put Selling Rolling Strategy
Read Part 2 of Put Selling and Rolling To Control Assignment

