AT&T Stock has been doing incredibly well in my US Portfolio. You can review AT&T Stock trades for 2013 through this link. AT&T Stock trades on New York under the symbol T. Since bottoming at an intraday low of $32.76 on January 18, Put Selling has been simple as AT&T Stock has been in a general uptrend. On Friday March 28 T Stock closed at 36.69 for an increase of 12%. A very nice move to be sure. On Friday I closed by $33 strike naked puts for 3 cents which expire April 20 to prepare for more possible Put Selling opportunities in AT&T Stock.
AT&T Stock Chart
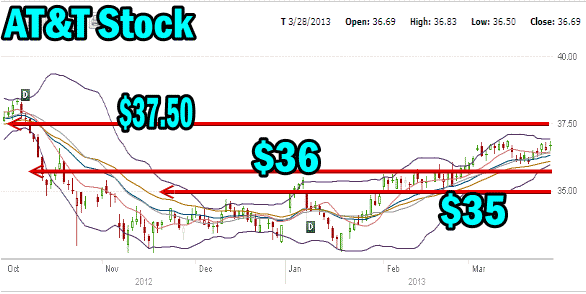
Looking at the 6 month chart on AT&T Stock you can see that since January 18 the trend has been a steady recovery. The present outlook looks like the stock may want to push higher to reach $37.50 which is the high from back in October.

AT&T Stock Daily Stock chart for 6 months
You can see the two strikes I am presently holding naked puts against, namely $35 and $36. The $36 actually does not have a lot of support whereas the $35 has good support which goes back further than the 6 months you can see above.
However with the stock continuing to push higher, I took advantage of a dip in AT&T Stock on March 21 and sold 10 naked puts.
Total Capital At Risk in AT&T Stock Trades Is Declining
Since starting into AT&T Stock in 2011, I have earned over $20000 in income and the total amount of my own capital at risk is quickly declining as I continue to earn more income from put selling. With this much income now realized from my Put Selling over the past 2 years, I can afford to sell larger quantities of put contracts and stay closer to at the money put strikes. For example, presently I am holding 10 naked puts at $36 and 5 at $35 both of which are set to expire in April. The total amount of capital to secure those puts is $53525.00 including commissions paid. However since I have earned $20561, the total of my own capital securing these puts is now down to $32964. ($53525 less $20561). Therefore if there was a sharp decline and I was assigned, my actual cost would be 1500 shares divided by $32964 for an average share price of $21.98.
T Stock Dividend Earned
If assigned shares the dividend of $1.80 would result in an annual return of 8.2%. You can begin to see the value of selling puts and using other people’s capital to help pay for any assigned shares when you realize that eventually these shares may end up costing me nothing from my own capital.
It is quickly reaching a point where it will not matter what happens with AT&T Stock since my cost basis will be almost to zero within just two or three more years. This makes Put Selling easier all the time since the worry about Put Selling at the money strikes and being assigned is alleviated by the amount of capital already earned to help pay for those shares when I finally am assigned.
T Stock Technical Outlook
The Technical outlook on AT&T Stock for this week looks like the stock could go either way however there is some evidence to suggest that the stock might fall back, even if for just a few hours on Monday in which case I will be tempted to sell in the May 16 options expiry and at the $35 put strike. Let’s take a look at the technical indicators on AT&T Stock.
T Stock At The Close March 28 2013
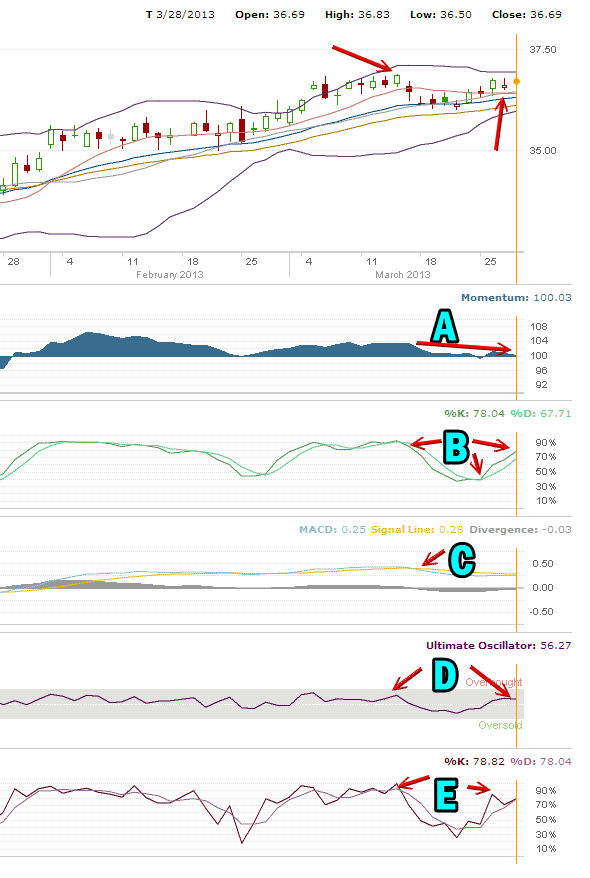
In the daily chart below there are a number of key aspects to mention. The first is that the intraday high on March 14 which I have marked with the first red arrow in the chart, was $36.87 and on Friday the intraday high was $36.83. The second red arrow is pointing to the 10 day simple moving average (SMA) which is definitely trending lower SINCE the high of March 14. This is indicating that despite the recent move higher there is no strength at present or no conviction on the part of investors to buy the stock and keep it moving higher.

AT&T Stock (T) Technical Outlook as of March 28 2013 at the close
A. AT&T Stock Momentum
Meanwhile A indicated momentum and you can again see the poor momentum in AT&T Stock throughout the latest little rally higher. Momentum can be poor and a stock climb but invariably the stock will turn and move quickly lower. This should present better Put Selling opportunities with higher premiums at the $36 strike particularly.
B. AT&T Stock Slow Stochastic
The Stock Stochastic off the last high gave a sell signal and then promptly fell. The big signal was then generated on March 25 and confirmed by a follow through on March 26. It remains in effect therefore even if AT&T Stock pulls back, it probably has enough strength that a pull back will be a dip but not a retrenchment back to $33 or $32.
C. AT&T Stock MACD
The MACD technical indicator issued a sell signal on March 18 but it was a weak signal although it is still in effect. The weak sell signal remains through the recent uptrend which was another clue that this uptrend would not be able to push much beyond the high of March 14.
D. AT&T Stock Ultimate Oscillator
The Ultimate Oscillator has been weak throughout this latest trend and indeed has not been able to establish readings as high as on March 14. This Ultimate Oscillator has shown that this entire uptrend has remained weak which makes it questionable how much higher the uptrend can go.
E. AT&T Stock Fast Stochastic
The last indicator reflects the same details as the previous stock indicators, weakness to this present rally in T Stock. The readings on this latest rally are not as high as the previous rally.
T Stock Outlook for Put Selling
For Put Selling then, AT&T Stock appears poised to turn away from this latest rally. Monday may see a feeble attempt to put in a new high for the present rally and break the March 14 high but with no conviction showing in any of the stock technical indicators it would appear unlikely a further uptrend can be counted on.
Naked Calls and Covered Calls
This could present an excellent opportunity for Naked Calls especially if on Monday there is one final attempt to move higher, which I am expecting in the morning. As well, for core portfolio holdings where the aim is to not give up their shares of AT&T Stock, this is probably a prime covered calls opportunity.
Put Selling Outlook Summary
For Put Selling I will be waiting a couple of days to see if T Stock pulls back which will push up the $36 put strike which is my primary interest at this point. Obviously the $35 put strike will increase in value as well although whether the April 20 options expiry for the $35 strike has enough time left to provide better put premiums, remains to be seen. It all depends on whether AT&T Stock pulls back just a little or a lot.
Since as explained I have already earned over $20,000 through Put Selling AT&T Stock over the last 2 years, I can afford to become more aggressive in the strikes being sold by staying closer to at the money and in increasing the number of put contracts I am selling.
For investors who have not been Put Selling AT&T Stock for as long as I have, they may want to scale into AT&T Stock puts by selling in smaller groups, possibly 5 at a time to see how low T Stock may go.
Next week should be pivotal for AT&T Stock and I am expecting that Monday will probably be the day to watch for a clearer direction which might be established for the rest of the week. Any movement lower and I will be scaling into more Put Selling at the $36 strike for April 20 options expiry.
T Stock (AT&T Stock) Internal Links
Review T Stock Trades For 2013
Review T Stock Trades For 2012
Review T Stock Trades For 2011
Review T Stock Strategy Articles
Review Members Only T Stock Strategy Articles

