Put selling as many investors know, is a strategy of consistently earning small premiums against stocks. While I mainly sell puts against stocks I would own if assigned shares, I know that most put selling strategies are used for earning profit and income without wanting to be assigned shares of the underlying stock. Recently I received a number of emails from readers wondering if I could put together a strategy for put selling against Amazon Stock that might allow an investor to sell puts while offering some protection against being assigned shares. I explained that a put credit spread would definitely assist, but these readers pointed out that a put credit spread only offered limited downside but still there was room for being assigned shares.
I spent some time looking at different put selling strategies. While I think investors who are averse to being assigned shares should consider a put credit spread, I came up with a combination of the 10 day simple moving average and the 20 day and 30 day exponential moving averages with the fast stochastic. These combination seemed to offer what the readers are looking for and I have used this strategy successfully over many years.
Amazon Stock Fundamentals
The last time I looked at Amazon Stock was in November 2011 in the article Amazon Stock Versus Apple Stock. At that point Amazon Stock was selling for 113.6X earnings and had a book value of just $17.07 and cash flow of $3.90.
As of April 27, Amazon Stock is trading at 186.3X earnings and book value has not increased at all. However cash flow is up .02 cents. The latest quarterly earnings numbers look good and show that Amazon.com is moving in the right direction, but does anyone actually want to own this company at 186.3X earnings? These numbers are reminiscent of the dot-com bubble days.
To start I think it is worth looking at a put credit spread strategy to see its advantages and its problems.
Put Credit Spread On Amazon Stock
Presently Amazon Stock is trading around 232.32. I will build this put credit spread around the May 19 2012 put options. The $230 put can be sold for $5.65 or 2.4%. For protection the $220 put can be bought for $2.50 which allows for a return of $5.65 – $2.50 $3.12. The most an investor can lose on this put credit spread is $10.00 ($230 – $220) less $3.12 = $6.88. The put credit spread always allows for protection and is the principal advantage of a put credit spread.
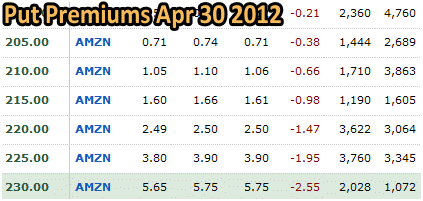
Amazon Put Credit Spread - Put Selling Premiums Available Apr 30 2012
Problem With Put Credit Spread
The problem I have with put credit spreads is the cost to buy the protecting put. Earning $3.12 against a possible loss of $6.88 does not fit my strategy of consistent earnings. Instead I prefer to monitor a stock’s progress and sell naked puts without the protective put. I realize that this means I have no protection in the event of a decline in the stock, but that is the reason I use my timing indicators and why I always sell puts only against stock I would own and Amazon Stock does not meet my criteria.
Put Selling With The Moving Averages and Fast Stochastic
Let’s move on to the 10-20-30 moving averages strategy and the fast stochastic for put selling.
The attraction of put selling Amazon Stock is high because profit potential is high, yet to insure that as an investor no shares are ever assigned from put selling, it is necessary to monitor the positions daily keeping a watchful eye on the moving averages and fast stochastic. To understand this put selling trade better it is easier to show a put selling trade as it unfolds.
Put Selling Image 1
I believe that images are the best way to convey a strategy to readers, but I know they can slow a webpage down. It is a tradeoff for sure. The first thing an investor should do is set up the 10 day simple moving average and the 20 and 30 day exponential moving averages. Stay within a 3 month time frame. Then on the fast stochastic set up the 70, 30 and 10 percentages as the key area to watch for. My settings for the fast stochastic are below:
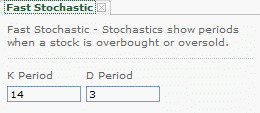
The Fast Stochastic Indicator Settings I Use
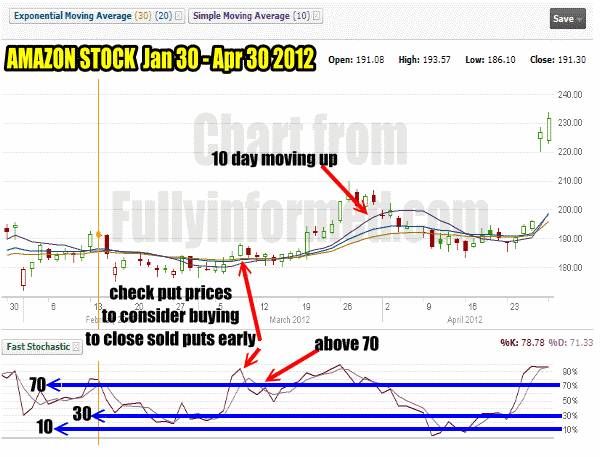
Put selling image 1 below shows the 10 day moving average is falling. A few trading sessions later the 10 day crosses the 20 and 30 day exponential moving averages. But checking the fast stochastic, I can see that the reading is above 70. This is not the time to sell puts. A reading above 70 marks an overbought indicator and could signal the stock is going to fall.
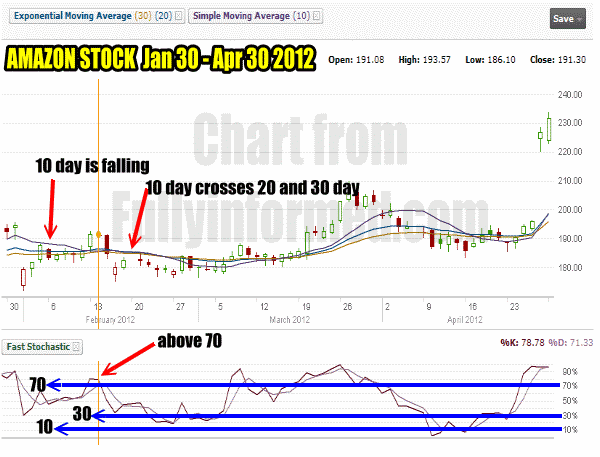
Put Selling Image 1
Put Selling Image 2
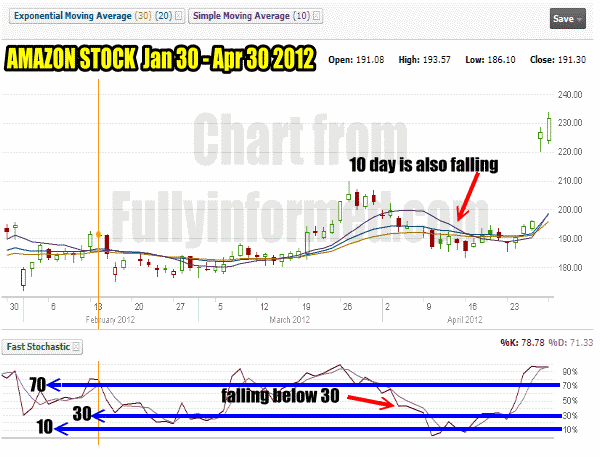
In put selling image 2, you can see that as the days pass, the 10 day simple moving average has crossed and fallen below the 20 and 30 day exponential moving averages. The fast stochastic has fallen below the 30% reading which marks an oversold indication on Amazon Stock. At this point an investor could consider selling the March $180 put which could have been sold for $4.05. The $175 put could also have been considered as it was trading for $2.85. By using this technical timing strategy for put selling, an investor can consider selling near the money or even at the money as there is a good possibility that the stock will move back up.
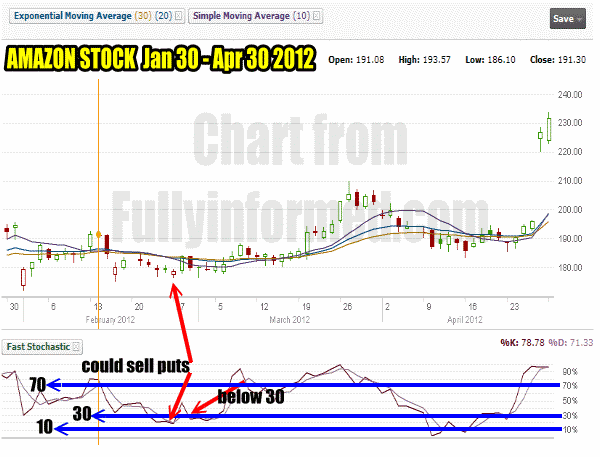
Put Selling Image 2
Put Selling Image 3
Once the puts have been sold, it is time to watch for an opportunity to close the puts and lock in the profit. One of the advantages of using both the moving averages and the fast stochastic together is to seek confirmation between the two tools. For example, in put selling image 3 below you can see that the 10 day has begun to move back up. However the fast stochastic has moved way above the 70% which is confirming the uptrend in Amazon stock. With the stock now moving higher, I watch the fast stochastic for any sign of trouble. As long as it stays above 50% the stock should climb higher. Looking out a few more trading sessions I can see that the 10 day crossed the 20 and 30 day moving averages and continued to climb.
This climbing could afford me the opportunity to close the trade early, but back my sold puts and wait for another signal to sell puts again. However as the rally continued past March options expiration and the fast stochastic did not fall, I would have held these puts probably to options expiration or certainly until they were trading for just .05 cents.
Put Selling Image 3
Put Selling Image 4
By early April the 10 day is falling back again and the fast stochastic is also declining. It falls below 30% but I can tell from the move down that the fast stochastic could fall below 10% so I normally either sell a few puts at this stage and then more later or I wait a little bit longer to do any put selling at all. The key though at this stage is that the 10 day is falling and as you can see crosses the 20 and 30 day moving averages marking another put selling opportunity.
Put Selling Image 4
Put Selling Image 5
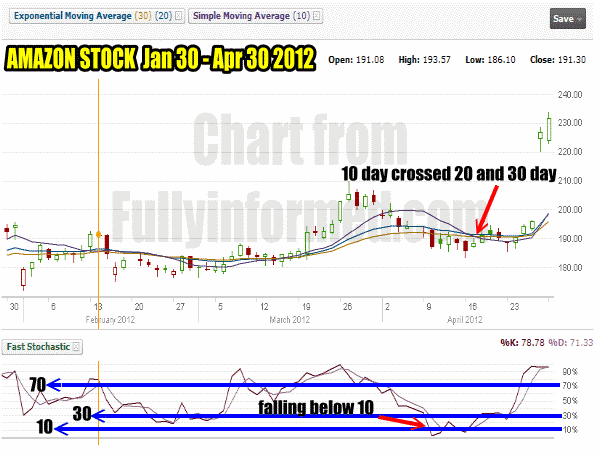
I have marked on the chart below the 10 day crossing over the 20 and 30 day exponential moving averages. The fast stochastic has fallen below 10%. This marks an incredible opportunity and I would not only be selling puts but probably considering buying calls or the stock for a bounce up. The $180 was trading for $2.50 and the $185 at $5.90. The $190 which was in the money for much of the day could have been sold for almost $7.00.
Put Selling Image 5
Put Selling Image 6
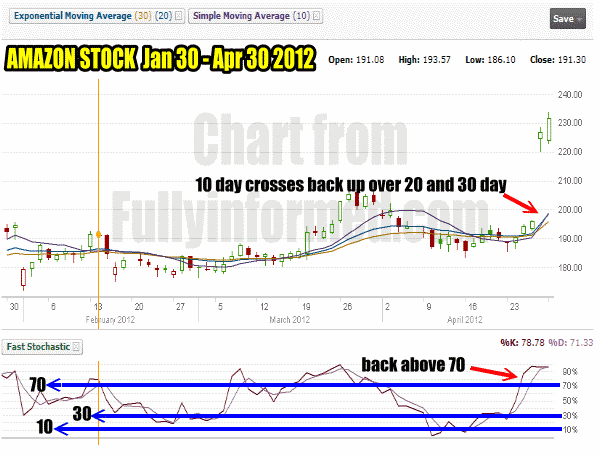
In our final put selling image you can see the 10 day crossed back up over the 20 and 30 day and the fast stochastic is back above 70% again. From here it would be a matter of waiting for the sold puts to fall in value, but them back to close the trade and lock in the profit. Then it is a matter of waiting for the next put selling opportunity.
Put Selling Image 6 - Final Image
Sometimes Simple Works Best
It may seem like the strategy is too simple, but sometimes simple works best. Overall I have had a lot of excellent trades using the above strategy. I have applied this trade to everything from ETFs and gold stocks to utility stocks for good profit gains. A strategy doesn’t always have to be complex. Some of the best strategies I know are simple to execute and boring to trade, but with investing boring is often good.
The key to the success of this trade is not second guessing the indicators but following them and placing the trade when the strategy indicates that the trade is ready to be implemented. The second key is watching for when to close the trade early. Why risk assignment if by closing early I can lock in most of the profit.
The concept is to not be assigned shares. To do this consistently means waiting for the 10-20-30 moving averages to indicate a pullback is underway and for the fast stochastic to give the oversold signal. Any reading below 10% in the fast stochastic is almost always a clear signal for put selling as normally a stock will bounce when it is extremely oversold.
Put Selling Amazon Stock Summary
Put selling is without doubt my favorite investment strategy. Through put selling I have so many benefits I can’t name them all. Put selling while avoiding assignment though requires a certain finesse and by using a proven strategy such as above an investor can earn good profits while avoiding the dreaded assignment issue. It is important to always remember that every strategy will not work every time. Put selling without a protective put on a stock such as Amazon Stock can be asking for trouble. However through carefully reading the fast stochastic and watching the 10-20-30 moving average strategy, an investor can do put selling against over-valued stocks and avoid assignment for a lengthy period of time.
I realize that often investors find following strategies difficult, especially when it comes to making that final put selling decision. If you would like to see this put selling strategy applied to your own trade contact me and I will try to detail out the strategy for you.
View The Profit And Income Strategies Index
View The Put Selling Strategies Index For More Put Selling Ideas

