A lot of investors thought Microsoft Stock should have been rising today with the big rally while instead it was falling. I received a lot of emails wondering why is Microsoft Stock falling. It’s pretty simple really, the stock is looking for support.
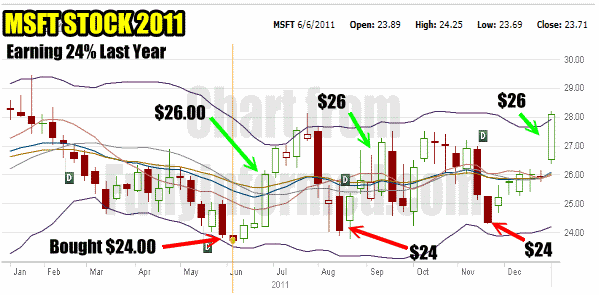
In much of 2011 MSFT Stock wandered in a range which was roughly $23.75 to $27.00. It was actually an excellent range for swing traders as every time the stock fell to $24.00 they stepped in an bought it, then they unloaded MSFT Stock when it would move above $26.00. Basically they were earning $2.00 every single trade or 8%. A local investor friend did this 3 times last year in Microsoft Stock. While I would never recommend this as the ultimate strategy for any investor, he does this style of trading with ALL his capital. He therefore earned 24% on his capital with what he felt was a very easy trade.
Earning 24% On Microsoft Stock In 2011
Below is his Microsoft Stock chart he provided me from his TD Waterhouse account which I marked for each of his trades from last year. The srock chart is set for weekly periods. Interesting how many different strategies investors have and use. My friend has done this type of trading for 25 years. What he likes is his capital is in a stock for a short period. If he is wrong, he gets out right away. His commissions are small and unlike myself, his capital is at risk for very small periods of time. His outlook right now on Microsoft Stock is he is not interested in it until he see a new range developing.

Trading The Range In 2011 In Microsoft Stock to earn an easy 24% Gain
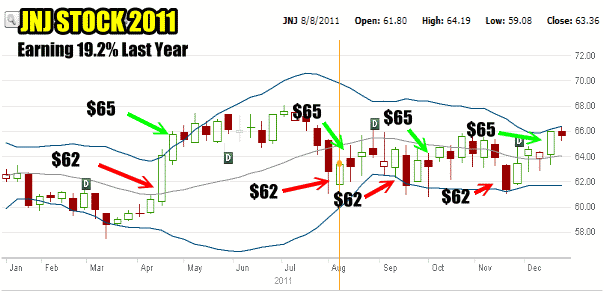
Not to be outdone, here is another chart from yet another investor friend who does the same strategy but on even MORE conservative stocks. Here is his chart from Johnson and Johnson Stock for 2011. Again, these types of investors are looking for solid trading ranges. With JNJ Stock he was buying at $62.00 and selling at $65.00 for 4.8% return. At year end with this simple strategy he had earned 19.2%

Johnson and Johnson Stock Trades for 2011 Earning 19.2%
This is why developing strategies that an investor is comfortable with is so important. I would never put all my capital into a single trade, but then these investors would never risk their capital all year long as I do. Everyone has a different level of risk and of comfort. But you can see from the above two trades that this style of investing is straight forward and pretty simple.
Getting Back To Microsoft Stock
However, returning to today’s Microsoft stock price, (April 11 2012), you can see in the chart below that after January the stock had a terrific run-up. I wrote a number of articles which you can review at the Microsoft Stock Index page discussing the rise and what I was expecting as well as my put selling against a rising stock article which examined put selling strategies against the rise in Microsoft stock.
The stock had a nice run up as you can see in the Microsoft Stock history below. Then a double top set in and the stock has pulled back ever since. Analysts meanwhile were bullish during the run-up and have become a lot quieter since.

MSFT Stock from Jan to April 11 2012
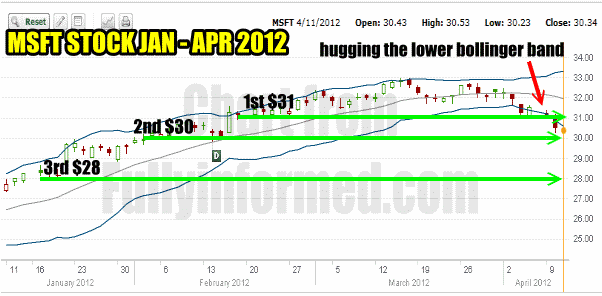
So the question of the day is, if the rise in Microsoft is now over. Personally I doubt it since I am holding stock in my retirement portfolio and I have also sold a large number of puts. The problem the stock has is there is no support. The support in Microsoft is all the way back to $28.00 and below. Therefore MSFT Stock is drifting lower as it searches for support.
MSFT Stock and Support Levels
I believe the support levels are $31.00 for the 1st level, which has now broken and then $30.00 for the second level which the stock is close to breaking. From there the next level of any firm support is around $28.00.
Could it get that low again?
I imagine it could if the selling should intensify simply because there is really no support at the 1st and 2nd level other than very soft support. Therefore for those who do not want to own the stock, put selling at this level is unattractive. Personally I would consider selling puts at $28.00. Today the May $28 is already trading for 1% or .28 cents. Trades were as high as .30 cents. For risk averse waiting for the stock to turn might be best before selling, but then the premiums will be poorer if the stock stalls here and drifts sideways.
Apply Market Timing Technical Indicators
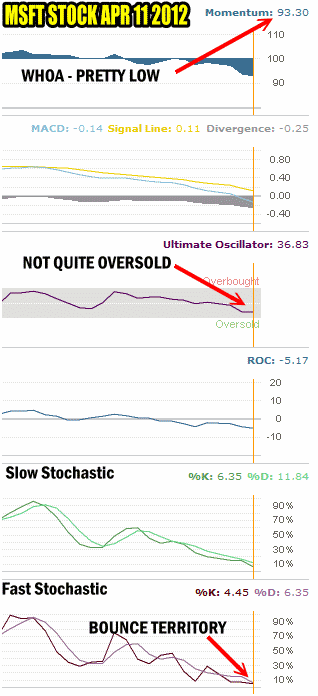
To understand the stock better, I like to take my market timing technical tools and apply them to the stock. Let’s look at the Microsoft Stock Technical Outlook based on the same tools I use to gauge the market direction.

Microsoft Stock Price For April 11 As Reviewed By Market Timing Technical Tools
The market timing technical tools show that the stock is getting oversold. There is still room to fall, but not by much more. Therefore I would expect based on the Fast Stochastic, Slow Stochastic, Momentum and Ultimate Oscillator that a bounce may be in the works or certainly some sideways movement. After that the stock could rsume its move lower or stabilize and set a new higher trading range.
My friend who trades the stock is simply waiting for a new trading range to emerge before committing to the stock. On the other hand if Microsoft Stock should fall back to its old range, he will then start trading the stock again. In my case if Microsoft stock falls into its old trading range I will be rolling my puts down and out and reducing the number of contracts with each roll. My put selling strategy will be to slowly work my way lower in the stock while at the same time using some capital to sell puts at much lower levels.
Strategy Is Important
The steps above of reviewing the charts and applying the Market Timing Indicators is something I do with all my stocks. I suggest that all investors consider similar strategies.
Since I have a sound put rolling strategy which I have used many times in the past I am not concerned about Microsoft stock. My personal opinion on the stock is that it will recover and move higher. I believe it is under-valued at this level. The only problem I see is that MSFT Stock is considered under-valued by many analysts as well and that certainly bothers me. I preferred Microsoft stock when no one else was following it.

