Microsoft stock has had a bad rap for more than 10 years from investors. I read another article today where investors were saying they may as well have put their investment in a Bank Certificate earning 2.5% rather than Microsoft Stock. That is such a shame because Microsoft Stock has provided me with annual double-digit returns since 2000. It all comes down to thinking a little outside the box as it were. Instead of buying and hoping, if investors just used a few different strategies they could have earned excellent returns in Microsoft stock each year. What investors also do not realize is that a range bound stock such as Microsoft stock also often means limited risk to the downside.
Imagine earning annual double-digit gains and never worried about the downside risk in the stock. This type of stock is what I look for every day in the stock markets for put selling.
Put Selling Microsoft Stock For 10 Plus Years
Put selling has been the principal method I have used to earn those returns on Microsoft stock. Most of the time put selling is straight forward as Microsoft stock stays in a nice trading range.
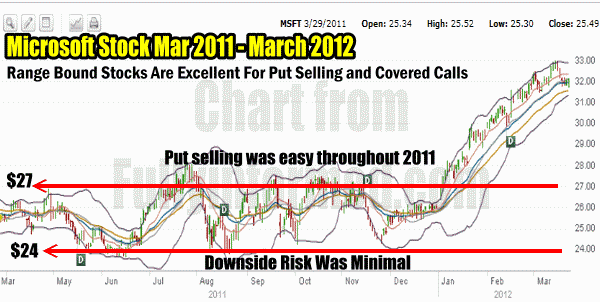
For example the Microsoft stock history chart below shows the period from March 2011 to March 2012. For most of that period the stock stayed in a range between $24 on the low side and $27.00 on the high. This made put selling easy. I simply stayed between $25 and $26 selling those put strikes throughout the year. Nothing could have been easier and premiums were decent for the entire year making the returns for 2011 easy and better than 20%.

Put Selling In 2011 Was Easy In Microsoft Stock
2012 looks like it may turn out to be another great year. I believe strongly in staying with quality companies. I like to stay with companies that in the event of a market collapse can be counted on recovering back to their principal trading range once all the panic ends.
Microsoft Stock Is Easy To Buy In A Panic Sell-Off
In 2009 for example I bought shares below $16.00 in the panic. The only way I can pick up prices like these on this type of quality stock is by having confidence that Microsoft will withstand market gyrations and analyst downgrades and continue to bring in higher revenue and increased profits, which is exactly what Microsoft has been doing.
Microsoft Stock Is Now Considered Too Cheap
While many analysts are busy talking a storm over Apple Stock and the company I have been happily put selling against Microsoft stock which did not catch the attention of analysts until into late December 2011 when all of sudden they jumped on the Microsoft wagon and announced that it was “too cheap” and “terribly under-valued” which has brought the stock back into a rise.
Microsoft Stock Recent Rise Is Nothing New
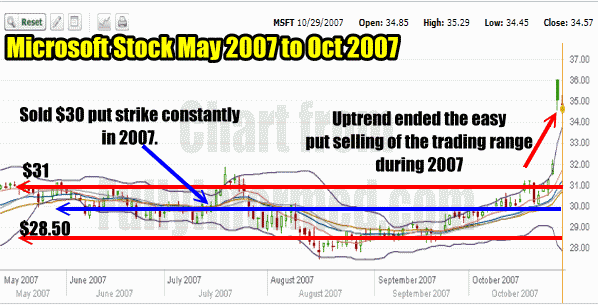
This has happened many times over the past decade. For example throughout much of 2007 I was put selling Microsoft stock easily as it stayed in a very tight range and then in late October 2007 analysts jumped in again and sure enough Microsoft stock rose rapidly or as you can see in the chart below.

In 2007 Put Selling Was A Simple Matter Of Selling The $30 Put Strike On Microsoft Stock Until It Started An Uptrend in 2007
How To Trade The Rise In Microsoft Stock
So what do I do when Microsoft stock rises rapidly? Simple, I follow this stock higher through put selling in a ladder fashion following the stock higher.
This is not a put selling strategy I would use on a stock that I would NOT want to own. Once the excitement is over with Microsoft stock it could easily pull back to between $30 to $28. However until then I want to earn some very good put premiums on a terrific stock.
Put Selling Microsoft Stock Using MACD And Bollinger Band
On Dec 19 2011, with Microsoft stock at $25.55 I sold 10 Feb $23 puts.
I was still holding 6 Jan 2012 $26 puts which had originally been from a put selling trade back in Dec 2009 when I sold 10 Naked Puts for Feb 2010 at the $30.00 put strike. By Feb 2010 Microsoft Stock had fallen below $27.00 and I began a rolling strategy of buying back my deep in the money puts and rolling them further out in time, sometimes down and always trying to reduce the number of put contracts with each roll. As explained in my recent article on Put Selling And Rolling To Control Assignment, I had rolled continuously without ever being assigned shares despite the drop in Microsoft Stock.
January 2012 And The Uptrend In Microsoft Stock
In January 2012 Microsoft stock commenced an uptrend and I have sold puts since January based on the MACD (Moving Average Convergence / Divergence) market timing technical tool and the Bollinger Band.
Recalling the article on Early Warning Tools To Spot A Collapsing Stock, these two market timing tools can be a very good timing method to determine when to stay in a stock for put selling and when to get out. I don’t plan on explaining how I used this strategy for Microsoft Stock as it is well covered in the article on Early Warning Tools. Suffice to say that when the Bollinger Band and MACD signal that the stock uptrend is ending, I will be closing my put positions.
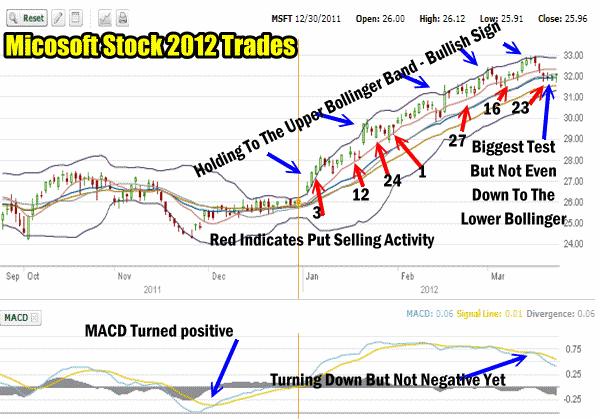
In mid-December 2011 MACD signaled an uptrend in Microsoft Stock. On January 3 2012 MACD signaled that the stock was breaking out. Microsoft stock on that day pushed to the upper Bollinger band and has until March 20, stayed to the upper Bollinger. Only in the last few days has MACD begun to warn that the stock may be changing direction. However MACD is not warning that the stock may fall yet as MACD although turning down is still positive.
The most Bullish signal as you can see from the chart above is that Microsoft Stock has riding the Upper Bollinger Band and every pull from the Upper Bollinger has seen the stock return to the Upper Bollinger Band. Every recently (March 23) the stock has still not touch the Lower Bollinger Band.
Microsoft Stock Purchased In Retirement Portfolio
Based on MACD I bought shares of Microsoft stock in my retirement portfolio on Jan 3 and on March 22 sold covered calls. I explained in my article Microsoft Stock and Hedging With Covered Calls my reasons for selling covered calls and my outlook on Microsoft Stock.
Microsoft Stock Put Selling Trades In USA Stock Portfolio
I cannot do put selling within my Retirement Portfolio due to Canadian Law, I therefore am holding Microsoft stock and covered calls in my retirement portfolio. However in my USA Stock Portfolio I have been engaged in a series of put selling trades against Microsoft Stock since Jan 3 2012. All of my put selling trades have been based on the market timing technical tools of the Bollinger Band and MACD.
Each successive put trades on Microsoft stock has been followed by checking the Bollinger Band and MACD for signs of a change in the uptrend. On weakness in particular I have sold naked puts since none of the pullbacks have flashed warnings in both MACD or the Bollinger Band. As long as MACD is not flashing a signal that the stock is going to fall, I will continue with this put selling strategy.
Here are the trades to date: (all figures are US Dollars and include commission charges). The dates are shown on the chart above.
Jan 3 with Microsoft Stock at $26.50 I sold 20 Feb $26 puts for .58 cents = $1128.00
Jan 12 with Microsoft Stock at $27.80 I sold 20 Feb $27 puts for . 47 cents = $908.00
Jan 24 with Microsoft Stock at $29.35 I bought to close 20 Feb $26 puts for .04 cents = ($112.00) * (Position Closed early)
Jan 24 with Microsoft Stock at $29.35 I sold 20 Mar $29 puts for .61 cents = $1188.00
Feb 1 with Microsoft Stock at $29.85 I bought to close 20 Feb $27 puts for .04 cents = ($112.00) * (Position Closed early)
Feb 1 with Microsoft Stock at $29.85 I sold 20 Mar $30 puts for .45 cents = $868.00
Feb 27 with Microsoft Stock at $31.25 I sold 20 Mar $31 puts for .42 cents = $808.00
Mar 16 Expiry March $30 and $31 puts expired
Mar 23 with Microsoft Stock at $31.85 I sold 20 April $31 puts for .35 cents = $668.00
Total income earned to date is $5344.00. Capital presently at risk = $62000.00
Return = 8.6%
While my return pales when compared to the more than 20% rise in Microsoft stock, I prefer the ease of put selling a rising stock like Microsoft stock versus buying and holding the stock. While it is easy now to look back and reflect that buying the stock was the better choice, I have been able to enjoy both the rise in the stock through my retirement account where I am holding shares bought Jan 3 and in my USA Stock Portfolio where I have done my put selling trades.
It is important to realize that put selling is a strategy of small gains which when earned consistently compound to larger gains. However once a put is sold, my profit for that trade is locked in. With a stock once it is bought, if an uptrend continues I should always be able to earn larger profits trading stock than selling a put at the money or slightly out of the money. However a stock that is rangebound will consistently provide excellent put selling returns.
Microsoft Stock and Put Selling The Uptrend
I am continuing to sell puts on Microsoft Stock and unless some unforeseen event occurs (think Iran or Italy, Ireland, Spain) I believe Microsoft Stock will continue to rise in the present market exuberance. I will be put selling all the way up and closing early when possible. By closing early I am releasing my capital for further put selling and locking in my profit earned.
Through using this strategy of following the rise in Microsoft stock and closing early I expect that when a downturn does come I can easily close my put trades at that point and if there is a loss it will be minor in comparison to the returns I will have made in my put selling trades of Microsoft Stock.


