I have been Put Selling Microsoft stock since 2009. Microsoft Stock trades on the NASDAQ and its symbol is MSFT. The returns from Put Selling Microsoft Stock have been excellent each year but the stock has not really gone anywhere over the past 5 years. The recent earnings from Microsoft Stock were a lot better than analysts and investors estimated. With profit of $6.06 billion, up 18.5 percent from a year ago Microsoft certainly provided strong numbers. With the consumer and business markets supposedly providing very weak PC demand, Microsoft’s Windows 8 product held its own. Sales were not stellar but they held up and that shows some strength in the pc market whether it be existing users upgrading or new users, there were obviously enough of them. Meanwhile XBox continued to generate revenue as did Microsoft Office and enterprise software. One of the more interesting items was the new office Cloud which provides Office 365 for users. Revenue was up for the Cloud service and Microsoft estimates that it will generate one billion revenue this year. Bottom line is earnings were better than expected and Microsoft stock has reacted well to the earnings news, so what does this mean for those of us who love Put Selling Microsoft Stock. Let’s take a look.
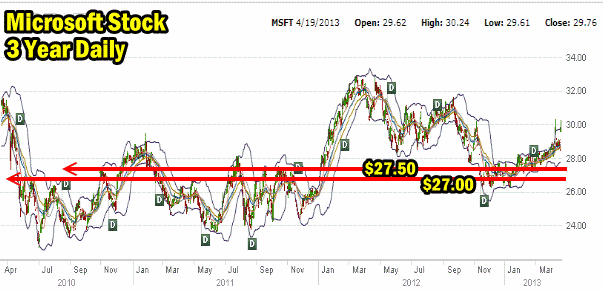
Microsoft Stock Three Year Chart
The earnings from Microsoft may be enough to keep Microsoft Stock above $27.00. Looking at the past three years you can see there is some support at $27 for the stock. In the last pullback in Microsoft stock in 2012 it fell to slightly below $27 but managed to hold support there. At $27.50 there is a small line of support that goes back three years. This looks like the “line in the sand” for Microsoft Stock going forward. If the $27.00 level breaks the stock will probably head back to $25.

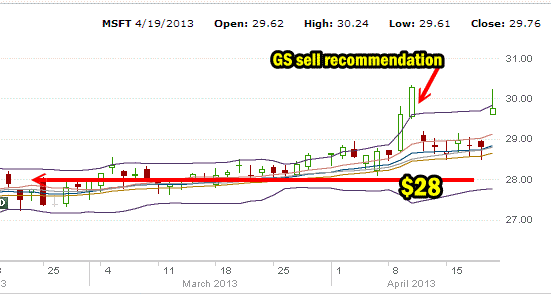
Microsoft Stock 3 Month Daily Chart
The last 3 months of Microsoft Stock is below. You can see the gradual rise in the stock and the a quick spike followed by an immediate recommendation that the earnings will be poor based on an expected decline in PC Sales and the stock was rated a sell. The stock fell back to below $29 but did not break $28.50.
Investors obviously had enough belief in the possibility that Microsoft earnings would be decent, to continue buying.

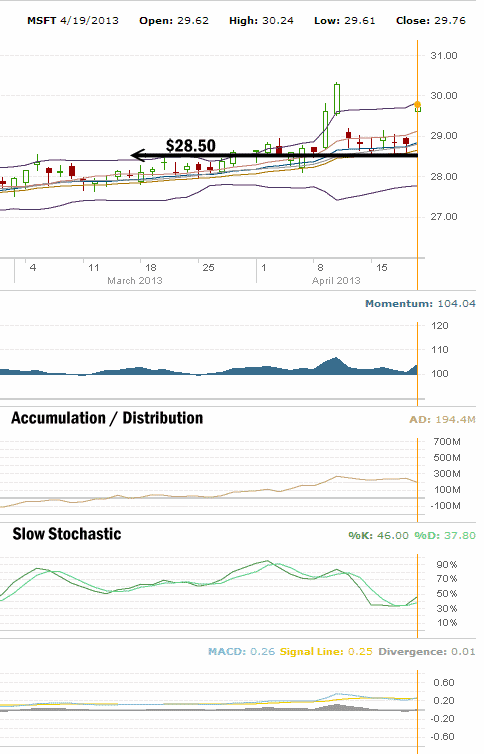
Microsoft Stock Technical Analysis
Looking at the technical analysis of Microsoft Stock you can see that despite the sell recommendation momentum never turned negative. As well note how the accumulation / distribution indicator shows that the stock was still being bought. Accumulation actually maintained its high level of accumulation despite the sell recommendation.
The Slow Stochastic issued a sell signal the day of the drop in the stock but went flat and within a day never hit oversold.
Last MACD hardly turned negative but instead stayed flat.

All of these indicators were the reason I continued to do Put Selling against Microsoft Stock at the $28 put strike despite the pullback. The sheer strength of the support at $28.50 was surprising considering that a sell recommendation had gone out on the stock and HP sales were dismal. You would have thought that accumulation would have had a bias to distribution but that was not the case. The accumulation / distribution tool is quite good at giving an indication as to whether more investors are selling (distribution) or buying (accumulation) in a stock. As soon as I saw how strong accumulation was I felt it was worthwhile to continue Put Selling into earnings.
Put Selling Microsoft Stock Going Forward
I would expect some pullback in Microsoft Stock but I will be Put Selling any dip as I do believe the earnings are strong enough to keep the stock elevated and probably push it back to $31.
Since the stock has been range bound for over a decade I doubt Microsoft Stock will break out from to all time new highs although I suppose anything is possible. Instead I think the stock will try to push over $30 and selling I would think, will pick up as investors still holding above $30 from last year will want out and investors who bought the stock at $27 to $29 will want out.
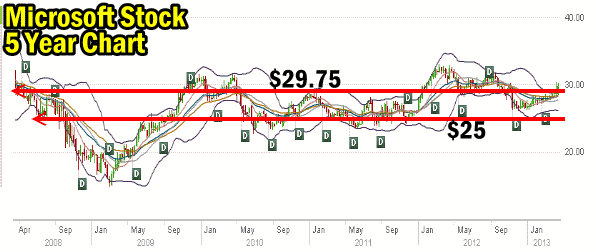
Microsoft stock is really more a utility stock and as such you need to trade it like a utility stock. That means buy it when it pulls back to its usual lows and sell it when it reaches to its highs. The 5 Year daily Microsoft Stock chart below gives you a good idea where to contemplate trading Microsoft Stock. Anywhere below $25 is a good buy, so the lower it moves beyond $25 the better the value and anywhere above $29.75 is worth selling the stock.

That also means being careful Put Selling Microsoft Stock above $29.75. One of the better methods for Put Selling Microsoft stock is to consider size positioning when Put Selling. From $29 moving lower an investor could consider increasing the number of puts sold. For example when Microsoft stock is at $25 an investor might sell 25 puts. When the stock reaches $26, he would sell 20 puts. At $27 he would sell 15 puts. At $28 he would sell 10 puts and at $29 he would sell 5 puts. This is just an example but it lays out a strategy that protects the investors from having all his puts at too high a level and ends up being assigned at high levels.
I will be continuing Put Selling Microsoft Stock into the rest of 2013 and probably into 2014. The company has a wide moat of cash, no real debt, a stranglehold on the PC operating environment, the office applications, enterprise servers, gaming through XBox, handhelds, surface tablets and a very solid dividend that the board of directors has increased every year. There is a lot to like about Microsoft Stock.
Microsoft Stock Internal Links
Index of Microsoft Stock Articles
Index of Members Only Microsoft Stock Articles
Microsoft Stock External Links
Microsoft Stock Investor Relations
Microsoft Stock Financial Statements

