Microsoft stock last year turned in double-digit returns for my USA Stock Portfolio. This continued a tradition for me with Microsoft stock that goes back to 2000 when Microsoft stock first entered my put selling portfolio. Recently I made a new put selling trade on Microsoft stock and I found myself reviewing my charts and notes all the way back to 2000. I realized how much profit and income was derived because I had always been able to review my Microsoft Stock trading journal. In simple terms, I have learned a lot from my put selling history on Microsoft stock.
Keeping a trader’s journal is an excellent means to learn from the past and not repeat the same mistakes. With Microsoft Stock now back in an uptrend, analysts and investors alike are getting excited about the stock again. But sifting through my trader’s journal, Microsoft Stock has been here before. So while many investors are dumping their capital into the stock at elevated levels, a lot of them would do well to look back through the stock’s history and possibly rethink their strategy.
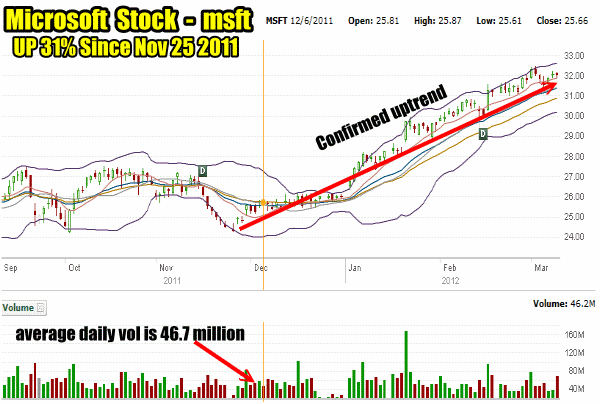
Since November 25 2011 Microsoft stock has risen 31%. This is a terrific rally, but after 31% should investors be thinking about buying this stock? Perhaps investors should be asking themselves these questions:
- What more upside is left in Microsoft stock after a 31% rally over the last 3 months?
- What about my put selling strategy on Microsoft stock. What strike prices should I now be considering for selling?
- What is the likelihood that Microsoft stock will pull back from these levels and return to a new trading range?
- What is the chance that Microsoft Stock could end up with $31 or $32 being the high-end of a new trading range?
Microsoft Stock to March 9 2012
The chart below shows the recent uptrend in Microsoft stock. I think it is folly to consider put selling at the present valuations, without taking time to look in my trader’s journal to see if I can uncover a possible strategy from Microsoft stock’s past.
Average daily trading volume is 46.7 million shares. The chart below shows that the average daily trading volume has been broken numerous times in the past two months as more investors put their capital into Microsoft stock. The recent pullback in Microsoft stock has seen a slight drop in volume which could signal a possible top of some kind in the stock.

Microsoft stock is up an incredible 31% since Nov 25 2011. To do put selling at these levels requires my reviewing the history of Microsoft stock to see how I handled other rises in the stock.
Microsoft Stock Learning From The Past
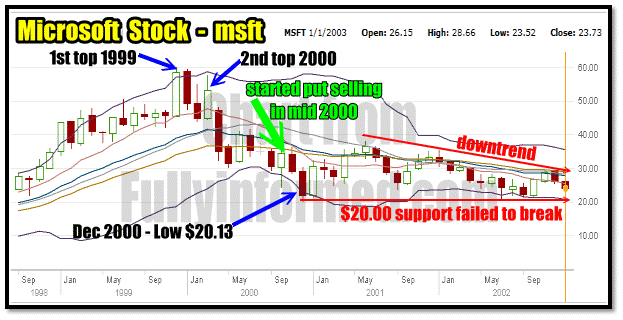
In 1999 at the height of the tech bubble, Microsoft stock was trading at a lofty $59.00 plus. The following year it put in a second lower top at $57.50 and then commenced falling, reaching $32.50 by the end of April 2000. Microsoft stock then set a low in December of 2000 at $20.13.
It was a terrific run-up in valuation in the late 1990’s as the tech bubble frenzy reached the final stages. Every investor knows what happened next as the NASDAQ collapsed and brought valuations back to earth. Stock markets are often easy to judge and in 1999 at the height of the bubble, I was surprised at how many investors were still buying into the tech hype.
While Microsoft was over-valued in 1999, by the end of 2000 it was back trading below $30.00.
Put Selling Microsoft Stock After The Tech Bubble Burst
It was in mid 2000 that I commenced put selling on Microsoft Stock. Put Option premiums were quite good and the stock had fallen out of favor with analysts and investors alike. With the stock in what appeared to be a long-term downtrend, put premiums stayed elevated. This made put selling fairly easy and profitable both years.
Looking at the chart below you can see what a lot of investors missed. In 2001 after the tech bubble burst the stock was in a confirmed downtrend but there was support at $20.00 which failed to break. This was my signal to keep put selling until support at $20.00 broke. If support at $20.00 broke, then I would have to roll whatever put option contracts I had outstanding, lower and then wait to see what new trading range emerged before committing any new capital.
The strategy back in 2001 – 2002 was:
- Keep put selling Microsoft Stock as long as it held support at $20.00
- If support at $20.00 were to break, roll any existing put option contracts down
- DO NOT COMMIT NEW CAPITAL UNTIL A NEW RANGE DEVELOPED
- Work any outstanding put contracts that had been caught if support did break, lower and then out.
The chart below shows the NASDAQ Tech bubble, the burst and the my start of put selling in Microsoft Stock.

Even though Microsoft stock did not break support at $20.00, having a plan is essential to proper investing. It is important to have the strategy in place AND the exit position already known BEFORE starting the trade. In the case of Microsoft stock during the 2001 – 2002 period, it was important to realize that the stock was in a downtrend and therefore it was obvious that I should not be selling puts near the top of the range (at the money) BUT stay to the lower end of the range.
The importance of strategy is obvious in investing whether you are put selling, day or swing trading, covered call investing or buy and holding stock. The strategy for Microsoft stock in 2001 to 2002 was simple. Put selling at lower strikes and staying away from the upper valuations.
STAY AT THE LOW END OF THE RANGE
Selling puts nearer the $20.00 support level should be an obvious move to put selling. By selling perhaps the $23.00, $22.00 or $21.00 strikes when possible this meant, should support at $20.00 break, I would have a much easier time rolling any put contracts caught in a break of support, lower. If I was selling puts at $28.00 and Microsoft stock had set a new trading range of perhaps $15.00 to $20.00, it would certainly be a lot harder and take a lot longer to roll put contracts from $28.00 to perhaps $19.00 and then down to $16.00, than if I was selling puts at $23.00 or $22.00 and support broke at $20.00.
This strategy should almost go without saying when it comes to put selling, but for a lot of investors who are chasing premiums, it is not obvious at all. Therefore they end up earning better returns than I would, because they are selling at the money all the time. But if the stock should break support, the extra earnings made will be quickly lost as they either buy back their puts for steep losses or commence a strategy of rolling down which could in some stocks take years to work their way out of the trade with some profit intact.
WHY NOT $25 or $26 PUT STRIKES
While I did sell some puts at $25 and $26 put strikes during this period, it is important to understand that you are viewing the above chart in hindsight. While it is true that Microsoft stock did not break support from 2001 to 2002, I had no way of knowing this at the time. Instead I monitored the stock and plotted each week over that 2 year period to keep an eye on support. I saw that long-term support remained at $20.00, but it is much easier in hindsight to say “should have sold the mid-way point”, rather than realize over the two-year period that it was more a strategy of suspecting that the support was somewhere around $20.00 and I should do my best to sell close to that support level, which meant selling the $24, $23, $22 and $21 Microsoft stock puts at varying times but rarely going beyond the mid-way point of around $25.
Therefore during this two-year period I did sell the $25.00 strike but only when the stock appeared poised to move higher.
Microsoft Stock Put Selling 2003 to 2006
In 2003 Microsoft announced it would be paying a dividend and this put the stock into a different trading range. Dividend buyers tend to buy a stock and hold forever. This offers a lot of support to specific dividend paying stocks. In the case of Microsoft stock, the range became $24.00 to $28.00. It was an incredibly profitable period as I sold the $25.00 and $26.00 strikes constantly in Microsoft Stock. The stock wandered within this tight range meaning that any time I had sold either of those two strikes and the stock fell, I felt confident the stock would recover, which it did.
At the same time, each fall to $24.00 was my cue to purchase some Microsoft stock for what I felt would always be met with a bounce. It did this three times and all three worked out. However the fall to $24.00 in early 2006 was not clear at first.
Microsoft Stock 2006
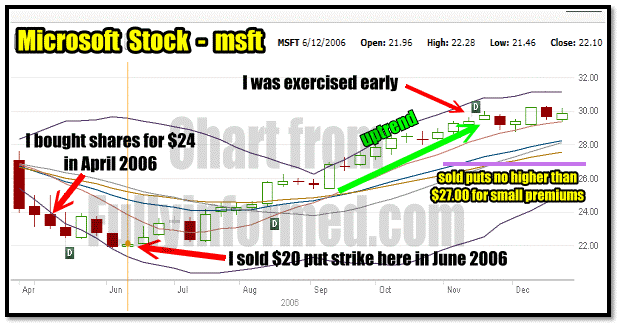
In April 2006 Microsoft stock fell back to $24.00 and I bought 1000 shares. This time though the stock continued to fall and lost another 10%.
By May of 2006 it was obvious to me that Microsoft stock was not going to see the bounce I had expected. I sold covered calls at the $24 strike for January 2007 and waited for a recovery. Meanwhile I also prepared to sell puts once the stock seemed to bottom. In June 2006 the stock reached a low of $21.46 and I sold the $20 put strike. My reasoning was that in the past there had been strong support at $20.00 and I doubted if this support would break. If it did, I felt that the stock couldn’t fall much below $20.00. I sold the $20 strike puts in June, July and August of 2006.
In early August Microsoft stock began a recovery and as the uptrend continued I sold puts but always out of the money and no higher than $27.00. I was exercised early from my covered calls and because my interest was not owning the shares for any period of time I did not buy back the covered calls and roll them out further. It may seem strange to be exercised for a ten-cent dividend, but the premium in my January $24.00 call had not enough premium left since the stock was above $31.00. As well the market makers pay no commissions and 10 cents to them is a terrific gain considering the millions of shares they would be exercising.

Microsoft Stock in 2006 showing my stock purchase, covered calls and put selling
Throughout the rise in Microsoft stock I followed the stock higher until it reached over $27.00. At that point I stayed with the $27.00 strike and sold it further out in time for small premiums. I felt the move higher was not justified and I wanted to wait and see if Microsoft stock could establish a new higher trading range, possibly from between $32.00 to $26.00.
This of course did not happen.
The double digits returns I achieved for this six-year period is directly attributable to stock chart watching. It was a matter of picking the range and put selling within the low-end of that range. Starting in 2007 that range changed making put selling Microsoft stock a lot more difficult. This ends part 1 of this article.
Part Two of this Microsoft Stock article will be up shortly.

