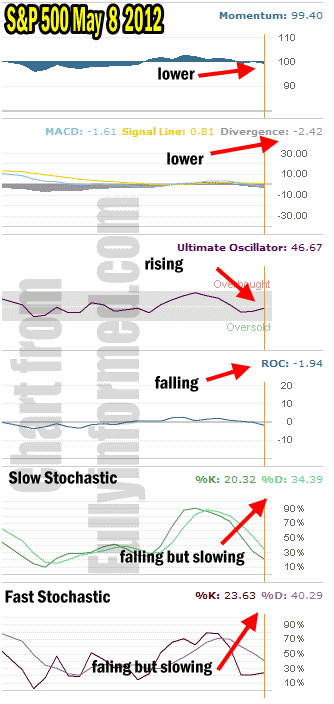
Market timing is composed of technical indicators and fundamental indicators. I have written about these two market timing indicators many times on my website. I use both technical and fundamental when deciding on market timing and market direction. Just on May 7th in my market timing column I indicated that while the market timing technical indicators may point to market lower I felt fundamentally that the market might bounce. I was wrong and the technical indicators were right. This evening I am back to the same point in market timing decision-making.
Today’s selling pushed the S&P 500 into a new low for the recent stock market weakness. Today intra-day low of 1347.75 broke the 100 day moving average for a brief period and pushed the S&P 500 below the important 1350 support level. At 1350 support held, the market wandered back and forth against the 1350 quite a few times before finally taking off and closing near the highs for the day at 1363.72.
Market Timing And The 1350 Break
The fall to 1347.75 is a fall of 74.63 points from the April 2 high of 1422.38. This marks a drop of 5.2% and pronounces this recent weakness as a correction in an ongoing bull market. While the break of 1350 for only a brief period may not be concerning, the more impressive event was the inability of the bears to push the S&P below that level again during the day and indeed the S&P pushed back up but unlike the NASDAQ Index which closed above today’s open, the S&P did not close higher than today’s open.
So as impressive as the climb back from 1350 was, it is rare when in the midst of turmoil that a market does not retest those low points sooner rather than later.
Market Timing Fundamentally
Fundamentally the S&P 500 remains sound. Business earnings have for most stocks beaten analysts estimates and indeed businesses in general are doing well. This evening I read a report on Bloomberg discussing the growing confidence in US Businesses and how many businesses are ramping up employment. It will be interesting to see if it is all talk, which we have heard much the same for the past two years, or whether this will result in some serious job creation which is badly needed.
Fundamentally as well the strength shown by the NASDAQ, Dow and S&P 500 indexes today recovering from the day’s pullback was impressive and again shows that the fundamentals in the market are reasonably strong and there are still buyers. It is important though to mention that there have been more distribution days over the past two weeks than accumulation days which is a sign of weakness.
Market Timing And Europe
So how much of the present correction is being caused by Europe? That’s actually tough to answer because for the most part the markets were already overbought and ready to pull back despite Europe. It seems to me that fundamentally Europe was a catalyst that gave investors who have earned strong profits since November or December a reason to sell and move to cash to wait for the next opportunity.
Market Timing Technical Indicators For May 8 2012
Below are the market timing technical tools I use for timing the market. I am comparing these readings against yesterday’s market timing column readings in the chart below.
Momentum has fallen lower but I would expect this after today’s selling and at a reading of 99.40 I would rate it closer to flat than lower. However it is lower than yesterday and it should be heeded.
MACD (Moving Average Convergence / Divergence) is for many market timing technicians the tool of choice. I have seen many investors use only MACD for both short-term trading and long-term trading. MACD is continuing to move lower and as it is a momentum and oscillator is measures strength, momentum, duration and direction. The MACD Histogram below shows the growing momentum lower and as MACD measure duration the reading continuing to move lower indicates that the period of selling may last for a while yet.
The ultimate oscillator indicator is as most readers know a favorite technical analysis tool. It is interesting to note that it is moving higher. The Ultimate Oscillator settings I use are not 7,14 and 28. I use 5,10 and 15 but even when changed to 7,14, and 28 the ultimate oscillator indicator still shows a rising indicator which does make sense based on the strong recovery in stocks during the afternoon.
The market timing tool rate of change indicator is a momentum oscillator. The rate of change is back negative which indicates the market will move lower.
Finally we come to the market timing dual tools of the slow stochastic and fast stochastic. Today they are both showing market lower. Both stochastic tools are falling but they are slowing their descent. This is probably because of the push back later in the afternoon today in the S&P 500..

Market Timing Technical Indicators For May 8 2012
Market Timing Technical VS Fundamental Analysis Summary
Overall the market timing technical tools are bearish indicating the stock market has further to fall. Fundamentals though seem to point to the possibility of a bounce. This then is one of those days when making a decision is tougher. My instincts tell me we could see a bounce but then I thought we would have seen it earlier than today. But with my strategy of put selling and rolling covered calls lower I am prepared for either eventuality and that is what investing is all about.
