Market timing is considered by many people as inaccurate and not worth the effort. I am not sure what kind of effort it actually requires since it is only a matter of looking at market timing tools at the close of the day to get a prediction for market direction. It certainly does not take much time. Just a glance, really.
Another market timing complaint I hear is that it doesn’t give clear market direction calls. To investors, when they apply market timing technical indicators to the stock market, they are looking for exact and precise market direction indications. Basically investors want to know where will the market be tomorrow or a couple of days later. Sometimes market timing can be used to spot a bounce that could easily occur within a day or two. But most of the time market timing technical indicators are being used to signal dramatic changes in market direction.
How I Use Market Timing Technical Tools
I use market timing technical tools to watch the overall market direction to warn me about potential pullbacks. Since my principal method of investing is put selling against stocks, I am not as concerned about the market direction moving higher and my being unprepared for a rally. I use market timing indicators to watch the market and warn me when there is the potential for a serious pullback which could place my sold puts in the money.
The Problem With Put Selling
This is the problem with selling puts against stocks I would not want to own. Decades ago when I sold puts against a larger number of stocks I always found that just when I had sold a lot of puts, the market would suffer a serious setback and I would spend months working my put positions either back to break-even or to a slight loss and then I got out. This was a continual problem. Remember that put selling amounts to earning small gains when puts are sold. That gain marks the end of the profit in the trade. I hated selling a put for .50 cents and having to buy it back for $2.00. While this may not seem like a big loss, it actually is, whether it is 1 put contract or 10 put contracts.
Market Timing And Large Cap Dividend Stocks
I found by moving to large cap dividend paying stocks for put selling and including market timing technical tools I could improve my profit and income considerably. With large cap stocks, I became unconcerned about the stocks I had sold puts against. If the stock fell, I simply rolled and rolled my put contracts until there was no point in rolling further. I then accepted shares and sold covered calls. When the stock recovered I was exercised back out of my stock and I would start put selling all over again.
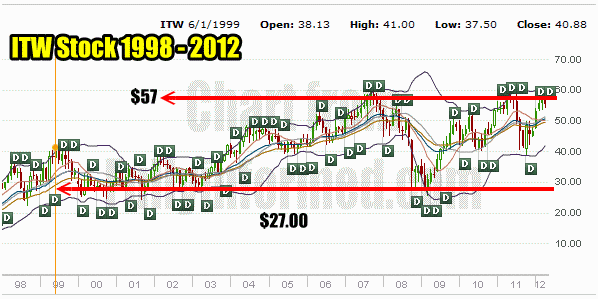
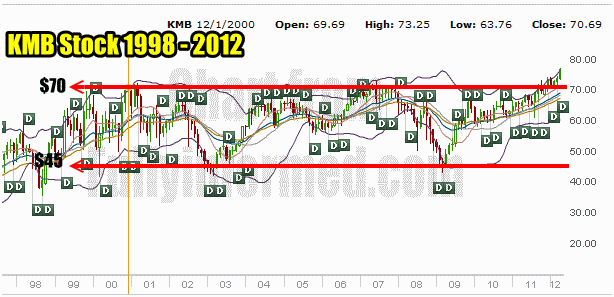
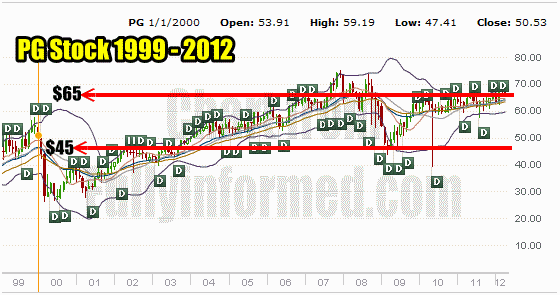
I found dozens of stocks that met my criteria. Despite the strength of large cap stocks, they too experience wide valuation swings. However unlike many juniors and commodity stocks I found that my stocks always recovered. The stock charts below show 3 such stocks.
ITW Stock (Illinois Tool Works) is a great example. The stock has recovered from every sell-off over the years.

ITW Stock Since 1998 shows how this stock has recovered from each sell-off
Another stock that meets this criteria is Kimberly-Clark Stock (KMB Stock). Every sell-off in the stock has seen a recovery.

KMB Stock is another good example of a stock that has recovered from every sell-off
My last example is Procter & Gamble Stock (PG Stock). This stock has recovered from every sell-off as well. These are only 3 examples out of dozens.

PG Stock is another stock that has recovered its share value from every sell-off
Strength Of The Big Cap Stocks
I found in a short time that Big Cap Dividend Stocks worked exceptionally well with market timing. Also by moving away from juniors, commodities and the like and turning to the largest of stocks with healthy balance sheets and increasing dividend payouts, I could sell puts, sleep nights and reap huge gains in any market, bull or bear. In essence they provided superior protection in any market downturn. Because of my belief, I could on any collapse, sell puts against these large cap stocks as they fell, because I have confidence that if I was assigned shares I would eventually be exercised out of those shares for a profit.
I found by adding market timing technical tools that I could pinpoint when to safely sell puts and when to be aware that the stock markets could take a tumble pushing stock values lower and volatility higher. Thanks to market timing technical tools I could look for periods of extreme oversold conditions, like market panics, and sell large quantities of put contracts with the conviction that if I was put selling at the wrong time, I could still end up with large profits when these stocks recovered.
Bear Market Panic 2009
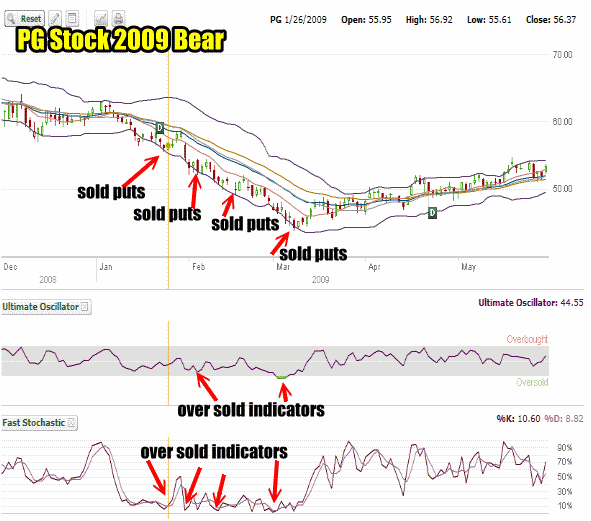
The chart below shows where I sold puts on PG Stock in the bear market panic of 2009. In a panic every stock, no matter how strong, will fall and when they do, investors dump their shares, fearful that “this time it is different”. I found that through combining market timing technical indicators, the Ultimate Oscillator and the Fast Stochastic in particular, I could safely sell puts on these large caps as they collapsed. Selling puts in a panic reaps enormous gains, but often the puts sold will fall in the money as the stock continues to decline.
For example on January 26 2009, I sold the March $55 put for $3.25 for a return of 5.9%. A few days later I sold the March $50 put for $2.55 and in March I sold the July $45 put for $5.90 or 13%. These types of gains are impossible to receive in any market but those with high volatility, which is a market in panic. But without market timing technical indicators to point periods of high stress and without faith that PG Stock would recover, it is impossible to receive these kinds of returns.

PG Stock and Bear Market Panic of 2009
Market Timing Tools Can Predict Market Direction
Using market timing technical tools to predict market direction change from up to down, I found that I could quickly stop selling puts and wait for the market to fall further, driving up volatility, before selling puts again for much larger premiums.
Put Selling In Uptrending Markets
Put selling always works best when the market direction is up. It’s simple to understand why. The market direction is up and my sold puts will almost always end up out of the money and not assigned. The problem is that as the market climbs, volatility decreases and put option premiums decline. However through combining large cap stocks and market timing technical indicators, I have found that I can sell puts on truly terrific stocks and earn higher put premiums thanks to the volatility. It is the market timing technical indicators that I rely on to keep me in the market when the risk of a severe pullback is low despite higher volatility.
Market Timing Technical Tools Allow Me To Stay In Highly Volatile Stock Markets
Therefore the market timing technical indicators are helping me earn very good option premiums and stay in the market despite the heightened volatility. I need this ability to earn substantial put option premiums. At the same time, market timing technical tools tell me when the risk of a severe market pullback is too high and I should stop selling puts and move to the sidelines.
Therefore using market timing technical indicators is paramount to my success in put selling. It is probably the key ingredient in my put selling investing that has earned for me consistent profits and allowed me to compound my capital with double-digit returns annually.
Calculating The Returns Of Mutual Funds
I aim for 12% a year return and unlike mutual funds and the like, I don’t have to fudge any numbers to figure out whether I have reached it. If I have $10,000.00 invested, then I know at the end of the year that if I have earned $1200.00, then I have earned 12% on my money. When I started investing I bought mutual funds and I could never figure out where they got their annual return percentages. Of equal concern was trying to understand their 5 and 10 year average returns and how they had been calculated.
Where Do They Get Their Returns?
Years ago before becoming interested in options, I had put $5000.00 of capital in a mutual fund on Jan 2 and I checked on December 31. If I had cashed it out including the extra shares I had earned and sold at the closing price on Dec 31 I would have seen a deposit to my investment account of $5,021.75. To me then I basically made $21.75 during the year or 0.435%. Yet the mutual fund company insisted that the year had seen another 7% return. I asked my broker to prove to me how I had earned 7%. We argued but in the end he couldn’t. I cashed out on Jan 4 of the next year and I still have a record of the amount that was deposited to my account. It was $5018.90.
Market Timing Technical Tools and Put Selling Combination
After trying different strategies I finally ended up with put selling as my primary investment strategy. I had some great years and some not so great. I decided to combine market timing technical tools to my put selling trades. I wanted to see more consistency with annual gains. When I added market timing technical tools I found a fringe benefit. They could be applied to individual stocks and assist me in timing when to jump in and buy some stock for a quick bounce.
Now decades later options have become main stream for a lot of investors. There are options covering every aspect of investing. Yet I have stayed primarily with the strategies that I developed over years of trial and error in my wish to compound my capital consistently year after year. Thanks to put selling options combined with market timing tools I have been able to enjoy substantial annual returns and stay on the correct side of the market most of the time. I suggest every investor set aside their personal observations and try applying market timing tools to see if it can assist their trading strategies. After all, as an investor isn’t the purpose of investing to compound capital and build a strong enough portfolio to carry them comfortably through retirement. If market timing technical indicators can help, then I do not know why investors wouldn’t at least try applying them to their portfolios even if only to have some prediction about market direction declines.
