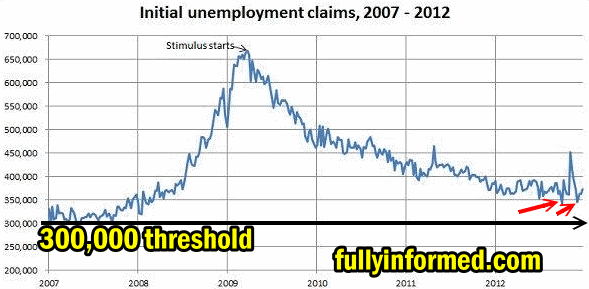
Every Thursday I check the Weekly Initial Unemployment Insurance Claims as it remains one of the best market timing system. This week’s Initial Unemployment Insurance Claims showed a decline back below the 350,000 level to 346,000. A lot of reporters referred to this as a significant drop. I don’t see this as a big drop but rather as a possible change in direction. In general the belief is that claims numbers before 350,000 indicate a moderate growing labor market. However a move back below 300,000 is what the economy really needs to show robust growth.
Market Timing System – Weekly Initial Unemployment Insurance Claims Chart
If we look at the Weekly Initial Unemployment Insurance Claims chart below you can see that we are still above 2007 levels before the credit crisis and recession got underway. You can also see that we are a long way down from the claims in 2009 when the numbers had risen above 650,000.

Market timing system based on the USA Initial Unemployment Insurance Claims
Present Market Timing System Forecast
But this latest Weekly Initial Unemployment Insurance Claims report is important as it showed that the numbers are showing the largest weekly decline since mid-November. Meanwhile the four-week moving average which often gives a good indication of the trend showed a rise in the number of jobless claims by 3,000 to 358,000. So just like the economy in general, there are mixed signals coming from the employment numbers.
Using This Market Timing System
Despite the two different readings the Weekly Initial Unemployment Insurance Claims remains a very competent market timing system and again today’s move higher in the stock markets continue to follow the same parameters of moving higher when the 350,000 level is breached lower.
This remains one of the better market timing systems which has withstood years of use. While simple it is amazingly accurate at predicting the longer term trend. Today’s market direction movement is another indication of just how good this system remains.

