Market Timing Systems have been around as long as stock markets. Candlesticks as a market timing system for example was developed in the mid 1700’s in Japan based on the tracking or rice price movements. The candlestick system has millions of followers around the world. Many swear by the accuracy of candlestick market timing system. There are literally dozens more. The moon, planet alignment, weather, interest rate yields, who is in the Whitehouse and literally patterns of all kinds.
The market timing system I prefer is based on a variety of market timing technical indicators. Within that group of indicators is the Ultimate Oscillator. I refer to the ultimate oscillator throughout many articles on my website and I use it every day in a variety of trades and way. As a market timing system though, I have found it to be very helpful.
The Ultimate Oscillator As A Market Timing System
Who Developed The Ultimate Oscillator
The Ultimate Oscillator was designed by Larry Williams in 1976. It became widely known in 1985 when this oscillator was discussed in Stocks and Commodities Magazine. Like all Oscillators, the Ultimate Oscillator is a momentum indicator. It is different from other oscillators though in that it looks across 3 time frames. By taking into account 3 time periods, the Ultimate Oscillator is much less likely to give a false buy or sell signal. An investor can set those time frames within the Ultimate Oscillator itself.
The standard time frame used by most people is 7, 14, 28 representing those 3 periods. For my market timing system, I prefer 5, 10, 15 which I have found through use, gives me more warning of a momentum change.
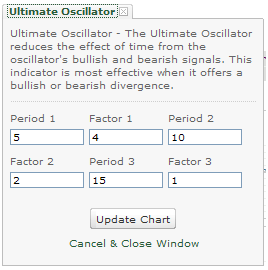
These are the Ultimate Oscillator Settings I use as part of my market timing system.
The Ultimate Oscillator is measuring momentum through buying pressure calculations. These calculations take into account buying pressure for overall direction (up or down), the magnitude of that gain or loss, the time frames involved in that buying pressure and the weighted average of the preceding three measurements. Therefore when I change the settings from the standard 7, 14, 28 I am getting a reading that takes into account a shorter time frame, which for my market timing system is what I want. An investor who has a longer time frame could theoretically change to an even longer time frame to look further out in time to possibly gauge mid-term or longer term stock market trends.For those who want to understand the mathematical formulas used you can select this market timing system link.
Market Timing Signals From The Ultimate Oscillator
I use the Ultimate Oscillator as it has a very specific criteria for when it generates a BUY SIGNAL and a SELL SIGNAL. The Ultimate Oscillator is an intriguing tool. To summarize:
ULTIMATE OSCILLATOR Market Timing Signals BUY SIGNAL:
The Ultimate Oscillator generates a buy signal when prices of the underlying stock are making new lows BUT THE OSCILLATOR DOES NOT. In other words, when the market continues to move lower in price but the Ultimate Oscillator does not follow lower it is advising me that the selling is overdone and the market may bounce back. This is a bullish divergence signal. When this bullish divergence continues and crosses the 50 point it generates a solid BUY SIGNAL. Normally I start watching for the buy signal anytime the Ultimate Oscillator is below 30.
ULTIMATE OSCILLATOR SELL SIGNAL:
When the ultimate oscillator moves above 70 I then watch to see if as the market rises in value, the Ultimate Oscillator readings follow OR do they not set a new high. This then reflects a sell signal. In other words, the market keeps rising, but the Ultimate Oscillator stops rising and begins to fall. This ia a bearish divergence signal, meaning the market looks like it is in a bullish stance as it rises, but the Ultimate Oscillator is turning bearish. When the ultimate oscillator crosses the 50 threshold as it falls this generates a solid SELL SIGNAL.
Ultimate Oscillator Theory As A Market Timing System
In theory the Ultimate Oscillator as a market timing system should be able to tell investors when to get into the market and when to stay out. To see how well it works in a crisis, let’s look at 2008. The chart below shows the market timing signals in theory. Every S equals a SELL SIGNAL and every B a BUY SIGNAL. Looking at the chart it is obvious that despite the high volatility of that period, the Ultimate Oscillator would have kept an investor from losing money. In fact he would have made money. Remember that the settings you are looking at our my settings of 5,10,15 on the Ultimate Oscillator. The standard settings did not reflect such strong oversold and overbought indications.
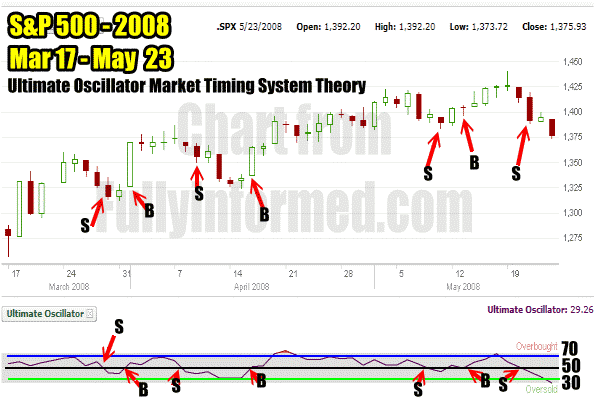
The Ultimate Oscillator Market Timing System Theory During Mar to May 2008
Ultimate Oscillator Market Timing System I Use
I do not use the above theory however to do my buying and selling. Instead as a market timing system I prefer to looking for stronger or more extreme signals both to get in and get out of the market. The chart below shows my trades against the S&P during the same time period. I was only in the market twice. While whether I made any more profit than the above investor would have I don’t know, but I do know from using the Ultimate Oscillator since the mid 1980’s that using the extreme readings has kept me out of the market during the worst of times.
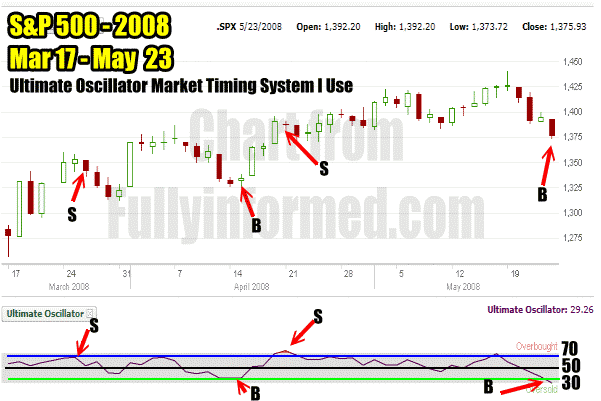
Ultimate Oscillator Market Timing System I Use
Ultimate Oscillator Market Timing System I Use – Aug To Dec 2008 Market Crash
During the market crash of the fall of 2008, the Ultimate Oscillator market timing system helped to generate profit and income as the market fell hundreds of points. If you check the chart closely you can see that some of the days had swings of almost 100 points in the S&P. The early part of September 2008 saw a loss with the trading, while the rest of the year saw very good gains, particularly the period of October to early November when the Ultimate Oscillator was almost perfect as a market timing system, predicting the recovery which lasted only until early November but which saw the S&P move over 100 points.
The difference here was that I sold any time the Ultimate Oscillator started to cross the 50 and then turned back down. As this was a bear market there never is any reason to hold positions when the Ultimate Oscillator falls back below 50.
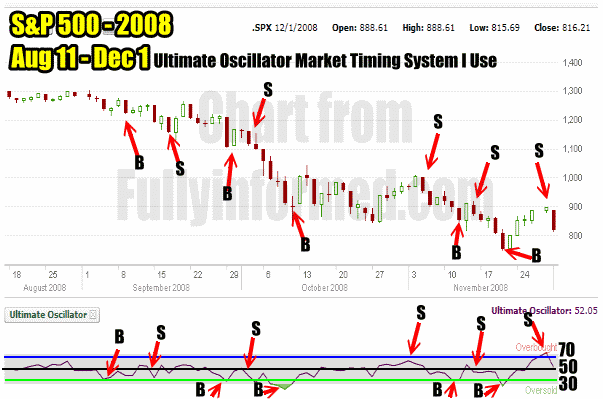
Ultimate Oscillator Market Timing System I Use During Market Crash Of 2008
Ultimate Oscillator Market Timing System And The 1987 Market Crash
This Ultimate Oscillator market timing system has saved me many times. In 1987 I avoided the market crash all due to the Ultimate Oscillator.My chart from that period is below. You can see that there was never a wrong call by the Ultimate Oscillator including after the market crash. Every market timing signal given was correct during this tumultuous period.
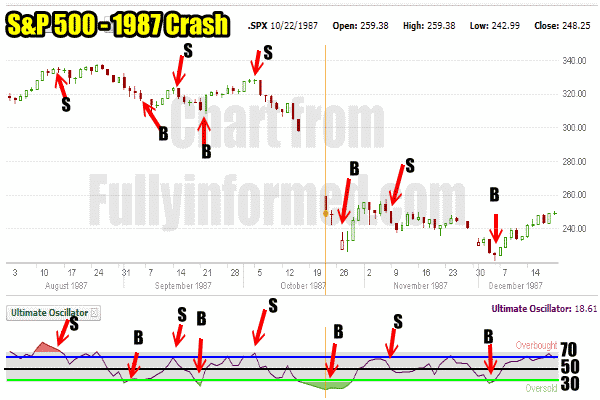
Ultimate Oscillator Market Timing System In 1987 Market Crash
Ultimate Oscillator Market Timing System And April 13 2012
Finally, one last chart. What is the Ultimate Oscillator Market Timing System telling investors presently as of April 13 2012. Looking at the reading, Friday April 13 2012 saw the Ultimate Oscillator close at 40.22. This is not oversold or overbought. There is still plenty of room for the market to move lower.
What is interesting about this chart is that twice the market has called the bottom in the recent move higher. I have marked those 1 and 2 on the chart below. Following those readings the Ultimate Oscillator continually showed overbought and any of those points would have given an investor a profit. By following the overbought condition and staying with the Ultimate Oscillator readings all an investor had to do was look for a drop in the Ultimate Oscillator readings as the market moved higher. This would tell the investor to sell. Knowing however that the market was in a strong rally, the investor could check each overbought reading and make sure that each time an overbought indicator is flashed that the reading is higher than the previous one.
For example on Jan 12 2012 the Ultimate Oscillator was in overbought territory and gave a reading of 75.39. On January 24 the reading was 79.61 which is higher showing that momentum is continuing to build despite the overbought condition. On Feb 9 the reading was 81.80. However on March 14 the overbought reading was 71.61 and by March 16 it has only climbed to 75.30 before falling. This is a sure sign to sell and could mark a turning point in the recent rally. When the initial 81.80 reading was given, the S&P 500 was at 1351.95. Presently the S&P is at 1370.26 which is 18.31 higher or just 1.35% higher. It will be interesting to see if the market falls to 1350 and holds. Personally I don’t think that will happen as I believe support is lower.
On the third reading which I have marked 3 the ultimate oscillator flashed just 40.07 on March 6. As well in the recent move lower and then bounce up the Ultimate Oscillator did not flash a buy signal.
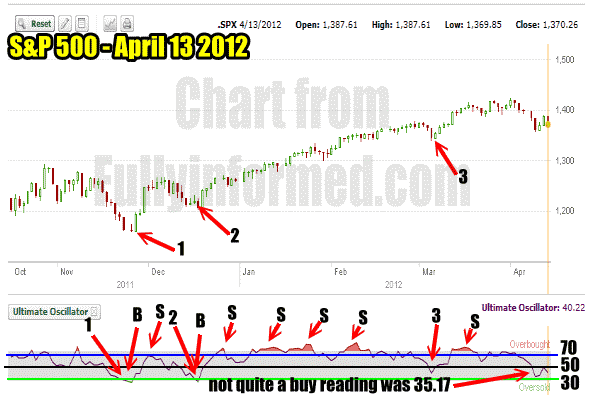
Ultimate Oscillator Market Timing System For April 13 2012
Market Timing System Using The Ultimate Oscillator Summary
You can see from the above charts and statistics that there is a lot to like about the Ultimate Oscillator. No market timing system is perfect but through using the Ultimate Oscillator, it can give any investor warning when the market direction is about to change and that is all it takes for any investor to both earn profit and have protection from market changes.
