Every Thursday I check the Weekly Initial Unemployment Insurance Claims to get some idea as to the market direction. Investors who frequent FullyInformed.com know that I use the Weekly Initial Unemployment Insurance Claims reports for market timing purposes. Over the past 3 decades the Weekly Initial Unemployment Insurance Claims has proved to be an excellent market timing system.
This week’s Initial Unemployment Insurance Claims showed the claims dropped last week to the lowest level in more than five years. Normally this tells investors that employers are confident enough in the economic outlook that they are adding workers to their payrolls. The decline though was not huge as the number of applications for unemployment insurance payments decreased by just 4,000 to 323,000. Still though this is the lowest level since January 2008 and continues to support this market timing system.
For the first time, the average over the past month was the lowest since before the great recession began in December 2007. Still, there are 11.7 million unemployed and an unknown number no longer seeking any kind of assistance or employment. In general the unemployment numbers monthly need to see 250,000 new workers a month to really get the economy back to unemployment levels of 6.5%.
Market Timing System Continues to Perform
According to this market timing system, today’s numbers support the market direction continuing to move higher. If there is selling pressure it can produce shallow dips but the history of this market timing system is strongly in favor of stocks continuing to move higher.
Market Timing System – Weekly Initial Unemployment Insurance Claims Chart
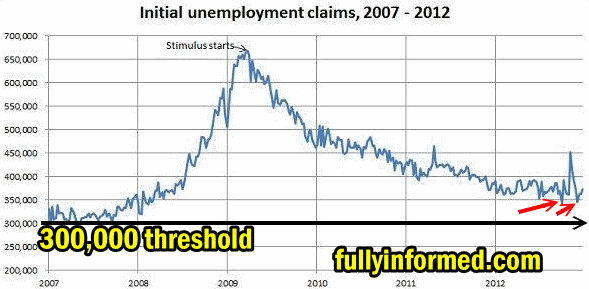
If we look at the Weekly Initial Unemployment Insurance Claims chart below you can see that we are still above 2007 levels before the credit crisis and recession got underway. You can also see that we are a long way down from the claims in 2009 when the numbers had risen above 650,000. Once the numbers fall below 300,000 the unemployment rate will drop significantly. This should lead to higher prices for stocks.

Market timing system based on the USA Initial Unemployment Insurance Claims
Using This Market Timing System
The system is simple to use. Numbers above 350,000 weekly are normally followed by weakness in the market direction move higher. Numbers higher than 375,000 have almost always seen sell-offs. Numbers above 390,000 are signals that buying puts on the market or purchasing Ultra Short ETFs warrant attention from investors. Today’s numbers should support higher prices for stocks in general and signal that dips in stocks should be bought or Put Selling done as overall the market direction should move higher.
The Weekly Initial Unemployment Insurance Claims remains one of the better market timing systems which has withstood years of use. While simple it is amazingly accurate at predicting the longer term trend. It should be interesting to see how the next week progresses particularly as we are in a “Sell In May” mood on market direction.
Internal Market Direction Links
Profiting From Understanding Market Direction (Articles Index)
Understanding Short-Term Signals
Market Direction Portfolio Ongoing Trades (Members only)

