Analysts had predicted the October non-farm payroll numbers numbers would be 75,000 to 85,000. A lower jobs number was predicted as analysts felt the GM labor strike would decrease the numbers. Instead the nonfarm payroll employment increased by 128,000 jobs for October. On top was news that August’s number was increased by 51,000 to 219,000 and September was increased 44,000 to 180,000.
October 2019 – Nonfarm Payroll Analysis
This is now the highest percentage of the workforce employment since 1969 and marks the longest economic expansion in US history. Gains were made across board and across all groups. Since President Trump was elected 6.7 million new jobs have been created. With more jobs created there are more people rejoining the labor force. This is the labor force participation rate and it rose to 63.3% in October. With more people looking for work, this pushed the national unemployment rate from 3.5% to 3.6%. This is also the 20th month of the unemployment rate staying below 4%. The pace of average hourly earnings rose 0.1% to a year-over-year 3% gain. The total employment level as measured in the household survey rose to 158.5 million marking another new record high.
October 2019 – Consumer Spending Outlook
The unemployment report is important as it shows not only the strength of the domestic economy but also trends in consumer income which relates to continued consumer spending. The October report points to the consumer continuing to have income to spend.
Market Timing System Says Stay Invested
One of the best market timing systems I have used is based on the unemployment numbers. At present that market timing system says “stay invested”. While nothing is fallible especially with market timing systems and investing in general, I have found the market timing system based on the employment numbers and in particular on the Weekly Initial Unemployment Insurance Claims to be a good system to spot when to expect weakness and a potential change in trend.
Weekly Initial Unemployment Insurance Claims Chart
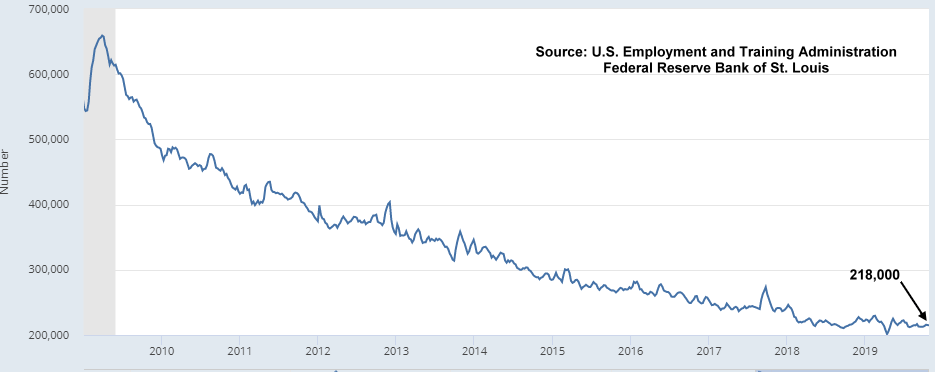
The chart below shows the Weekly Initial Unemployment Insurance Claims since January 2009. This past week, they reported 218,000 claims continuing the lowest number of claims in over 50 years. The trend remains steady and well below 300,000. For all of 2019, the Weekly Initial Unemployment Insurance Claims have stayed below 250,000 which indicates a strong economy with continued growth.

Market Timing System – Summary Outlook
All of these numbers points to the chance of an economic recession as being small. The model used based on the above monthly and weekly employment numbers still points to stock indexes pushing higher as this year draws to an end. Any positive, concrete news on a resolution of any sort on the trade front with China will push the indexes still higher. Any negative news will see indexes dip, but overall the jobs numbers to the end of October 2019 indicate any dip will be temporary and should still be considered a trade opportunity.
Internal Market Direction Links
Profiting From Understanding Market Direction (Articles Index)
Understanding Short-Term Signals
Market Direction Portfolio Ongoing Trades (Members only)
