Market direction change is sometimes easier to spot because of specific market timing events. While not entirely technical in nature, the change on Tuesday by the dip buyers failing to step into the declining stock market was a clear sign that the market direction would move lower. There was also good reason to believe market direction today would fall, because of the pattern established over the past 3 months of this rally.
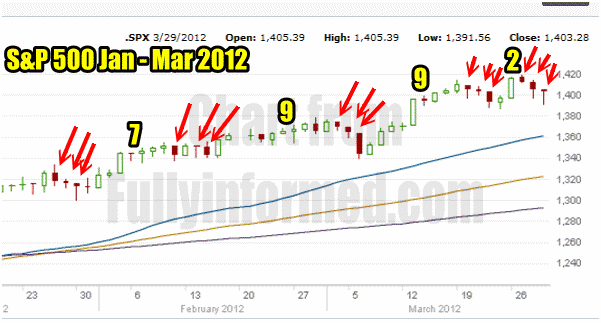
Throughout this rally every pullback in stocks has occurred over 3 trading sessions and then the market direction has pushed back up. If you look at the S&P chart below from January to March 29 2012 you can see this stair pattern. The dip buyers are very aware of it which is probably why on Tuesday the dip buyers stepped back and let the stock market fall further.
Market Timing / Market Direction Stair Pattern
The chart below shows the stair pattern which is typical of a bull market. The pattern is so obvious that those who buy put options must be enjoying it immensely. Every stair is made up of 3 down steps and then back up. The pattern has not failed throughout the past 3 months.

This market timing / market direction chart for Jan to Mar 2012 shows the stair pattern which is typical of a bull market.
Market Timing / Market Direction Problem Developing
There are now two market timing technical problems that are developing in this current “bull run”.
1) Looking at the above chart each stair pullback has been followed by 7 or 9 trading days that has moved the market higher. The previous stair though has only a two-day rise after the pullback which is concerning.
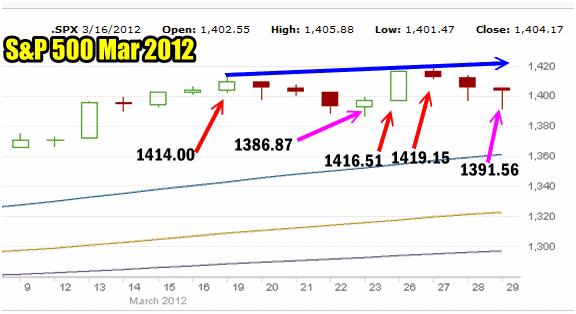
2) The market direction while still up has had a very difficult time of pushing into new higher ground. In the last rally the S&P pushed to 1414.00 and pulled back to a low of 1386.87 before the next rally commenced. That very short rally saw the S&P set a new intraday high of 1419.15 but that pales in comparison to the last 2 months when each rally turned in much higher gains in-between their respective pullbacks. While today’s market pullback saw market direction hit a lot of 1391.56 which technically kept the market in an uptrend since the low today was not lower than the previous low of 1386.87, the S&P must push solidly and decisively beyond 1420 to keep this uptrend alive.

Market Timing / Market Direction chart for March 2012
The Bernanke Bounce
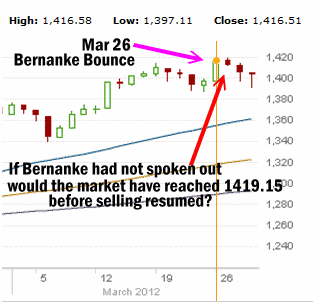
I cannot lose sight of the fact that the move higher on March 26 which saw an intraday high of 1416.51 was caused by the comments of Mr. Bernanke. If he had not spoken out it would have been interesting to see if the market did not in fact climb as high as it did. If that had been the case and then selling had returned, the previous high of 1419.15 would never have occurred and that would have marked a failed rally attempt a true market timing technical sell signal.
So while the dip buyers did a terrific job today and brought the market right back to close just above 1400, the question now is can the market direction continue higher or was March 26 just a knee jerk reaction to comments from the Fed chairman. From a market timing technical perspective the day after Bernanke’s Bounce, March 27, should have been a follow through day of some kind and this was not the case.

Market Timing / Market Direction showing the Bernanke Bounce
Market Timing / Market Direction Technical Indicators For March 29 2012
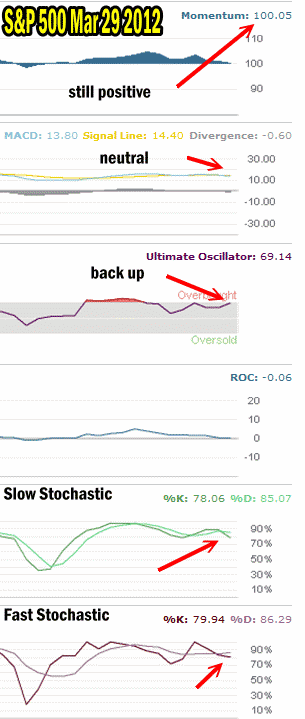
To assist in predicting what may happen next below are my market timing technical indicators from today’s S&P close. Of all the indicators each has an interesting prediction after today. Momentum is still positive which is a market timing plus for the bulls. MACD is solidly neutral. The Ultimate Oscillator is following through from yesterday’s rise and indicating that the market is entering overbought again, so this is a plus for the bulls.
Rate of change is flat. However Fast and Slow Stochastic market timing indicators are both warning that the market MAY be unable to rally further. This marks two pluses for the bears. Therefore with the results exactly evenly split it is a tough call which way the market may head.

Market Timing / Market Direction Technical Indicators For March 29
Market Timing / Market Direction Conclusion
Tomorrow if the market opens up and moves higher only to sell off I will take that as a sign that the rally is stalled. The S&P market direction must tomorrow regain momentum. If it fails to do so any move higher the first couple of days into April will be suspect. In particular if the market makes a new high in the next two days and then pulls back again, I believe the market could drift sideways to down while trying to gather support for another rally attempt.
Therefore because of my market timing indicators I am holding back and taking smaller positions such as I did today, in case the next major move ends up being down and not up.
