Market Timing technical indicators yesterday were mixed but the indicator I focused on was MACD or Moving Average Convergence / Divergence. It is an important market timing indicator when it comes to understanding market direction. MACD was developed by Gerald Appel in the 1970’s and the beauty of MACD is that this technical indicator is designed to spot changes in strength, market direction, momentum and DURATION of a TREND. While it can be used on any kind of asset class but it was designed for stocks and indices.
MACD belongs to the oscillator family of market timing technical tools and is based on moving averages. I capitalized two key aspects, DURATION and TREND because I have always considered them the most important aspect of MACD. While many technical indicators can signal an imminent change (for example the Fast Stochastic just two days ago in my market timing column indicated that a bounce was going to occur) MACD can tell me if there is enough strength in a move to sustain the TREND for a DURATION. In simple words it tries to predict if the trend or market direction is sustainable.
The second important part of MACD is that as a moving average indicator, it is a LAGGING indicator or a delayed indicator. BUT it is not as delayed as moving averages are because it contains TWO exponential moving averages and a smoothing setting which is comparing the difference between TWO exponential moving averages to detect small changes in the underlying trend.
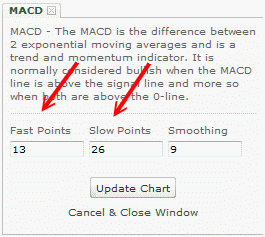
I have included below the common settings I use for MACD.

My Common MACD Settings
WEEKLY MACD HISTOGRAM
Another important aspect of MACD is the MACD Histogram. In fact a lot of investors trade based solely on the weekly MACD histogram for the overall market. I have an investor friend who follows MACD Histogram every week on the markets and on his stocks. Someday I must get him to write an article for all of us to learn his style of investing.
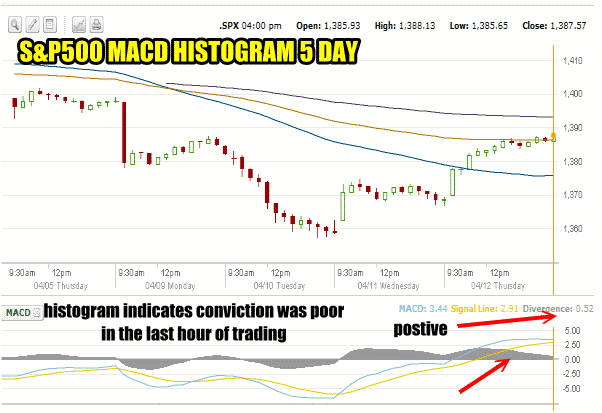
The MACD Histogram can be applied to different time frames to give a varied perspective on what the market is doing. For example below is the weekly MACD Histogram for this week. I have changed the settings to 10 and 20 to represent the 10 period and 20 period exponential moving averages since I want to get a reading more specific to just this week.

Weekly MACD Histogram Over The Past 5 Days
You can see in the above chart that the Histogram shows the lack of buying in the final hour of trading today despite the strong rally. Meanwhile the read at the close was positive, but it was lower than earlier in the day. The weekly histogram above would give many technical traders a reason to remain wary of this latest rally. Presently the histogram is not showing that it is sustainable.
Below is the MACD Histogram for the past 10 day period. The settings are now at 13 and 26 periods. The reading is more positive than the 5 day with a setting of 10 and 20 periods, but again the lack of conviction for investors in the final hour is obvious.

MACD Histogram for past 10 days
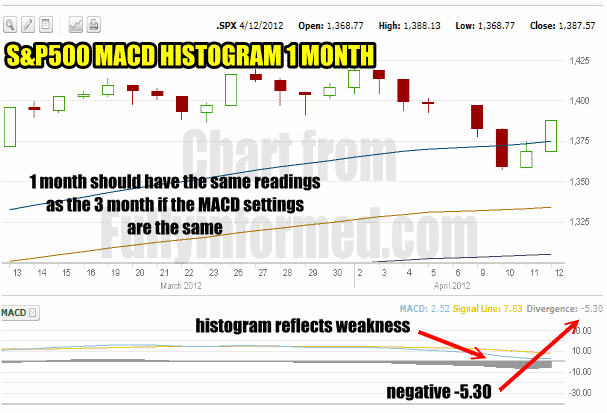
The third MACD Histogram chart below shows 1 month with a period setting of 13 and 26. Note how now that I have moved to 1 month the reading is actually negative and the histogram reflects lack of buying in the last hour of trading today. This reading is negative as the technical timing indicator is looking out over a period of a month and not just 5 or 10 days. While the 5 or 10 day may seem more positive, by going out further I can see that the prediction is that the market will not be able to sustain this rally.

MACD Histogram 1 Month Reading
A 3 month reading will be the same since my settings are 13 and 26 periods for the exponential moving averages. To get a different reading for the longer period of time, I would need to increase the settings to a longer time period to compensate for the longer period of time. Then the MACD histogram would reflect the longer term outlook on the S&P and naturally the reading would be different.
Comparing The Readings To Understand Market Direction
By comparing these settings I can get a better understanding of where the stock market may be heading. For example the 5 and 10 day chart shows that readings are improving and the histogram shows that momentum is beginning to rise which could drive the market higher SHORT-TERM.
However the reading for the 1 month period shows the remain negative which indicates that while the short-term, which might be as short as a day, is up, the longer term or mid-term is still down. In fact if I look back at the MACD reading from April 10 or Tuesday I can see that despite two days of strong rallying the reading is almost as negative as on Tuesday when the market declined rapidly.
Market Timing Technical Indicators For April 12 2012
To try to further understand the MACD Histogram I always add my other favorite market timing technical indicators to see their prediction of market direction and to find which ones support or disagree with MACD.
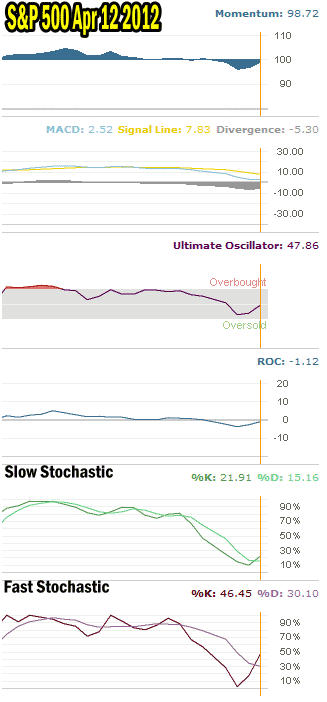
Below is today’s market timing technical readings.

Market timing / market direction technical indicators for April 12 2012
What The Market Timing Indicators Are Saying
Momentum is almost positive. The Ultimate Oscillator is also nearing positive. The Rate Of Change is still negative but it too is rising. Slow Stochastic though agrees with MACD with a reading of 15.19 however it has crossed which is a good sign that the market may try to recover. Finally Fast Stochastic also is up reflecting today’s stronger rally. Therefore only the slow stochastic is agreeing with MACD that the market may see more weakness ahead.
Market Timing And Predicting Market Direction
To understand how to predict overall market direction is actually pretty simple when using MACD. With the 1 month MACD still negative and the slow stochastic supporting MACD there remains a large degree of caution. While the shorter time period MACD Histogram charts reflect a probable continuation of the rally short-term, the mid-term is still saying that market weakness remains.
The remaining market timing technical indicators are all still NEGATIVE but are climbing. Therefore if I was trading in this market I would watch the open on Friday April 13 for weakness. If there was none then I would be trading expecting a higher move for the day. That could however end towards the afternoon as it is a Friday and it has been a volatile week and every knows that traders hate holding positions over the weekend.
On the other hand if the market opened and was weak then I would step aside and do nothing. I would definitely not be doing my spy put hedge because the market timing indicators are not saying the market is going to fall dramatically just that the market remains under pressure. Once all the indicators are back positive then I know that the market direction should continue higher.
Finally, if the market timing indicators rise and then turn sideways, it is a sign of caution. So even if the market timing indicators all get positive, EACH day they must show signs of improvement which should be reflected by the market grinding higher. If the technical indicators do not reflect improvement even though they are positive then it is a sign of concern and the prudent thing to do is to be patient and wait for a clear signal while at the same time staying cautious.
View More Market Timing Articles
