There are other aspects to market timing that are not technical indicators tied to stock markets. Sometimes you have to go beyond the stock markets themselves. The Case-Shiller housing report continues to show declines in housing. The fact that housing is down 3.6% in September from a year ago, versus 3.8% in August against the same month the previous year is nothing to celebrate. The Case-Shiller Home Price Indices chart below shows the overall trend, but remember this is just in 20 major cities across the nation.
With Detroit down to record lows it is not surprising that they are up 7.3% from their bottom and Washington housing remains good because of the federal government. If these two cities are removed from the equation, housing is a lot worse. Washington should be removed from the Home Price Indice to properly reflect housing. According to my market timing indicators tied to housing, they are pointing to a double dip in housing prices.

As a market timing indicator, the Case-Shiller housing index continues to warn that UNTIL there is a solid bottom in housing the stock market will remain range bound. It can rise, but every rise has to be suspect and probably sold into. Market timing indicates that the general market direction sideways trend in stocks remains intact.
Meanwhile the Case-Shiller housing index appears to be showing a double dip in housing which again market timing indicates is a possibility. While not as deep as the 2008-09 housing dip, there is definitely a glut of houses on the market. New home starts should be around 700,000 but instead are half that. The number of Americans moving into rental properties has doubled since 2008 and in some cities almost tripled.
Unemployment a 9%, extremely tight lending by US Banks who are flush with cash from the Fed but scared to lend and more and more homes sitting empty are keeping a lid on housing and continue to push down prices.
Market Timing / Market Direction show that housing must return to normal levels
My market timing and market direction indicators both show that until housing returns to normal levels, stocks will remain under pressure and volatility high.
The problem is that when housing prices are reviewed over the past 10 years, most communities saw housing prices escalate far beyond historic norms. While wages on average moved up by only 3% annually for “average” Americans, housing in some cities doubled and tripled over the last 10 years. An average home in Las Vegas in 2003 could be purchased for $200,000.00. By 2008 the same home was over $750,000.00. Today many of these same homes are still up for sale at $480,000.00. At a rate of 3% a year such a home would be worth less than $300,000.00 today.
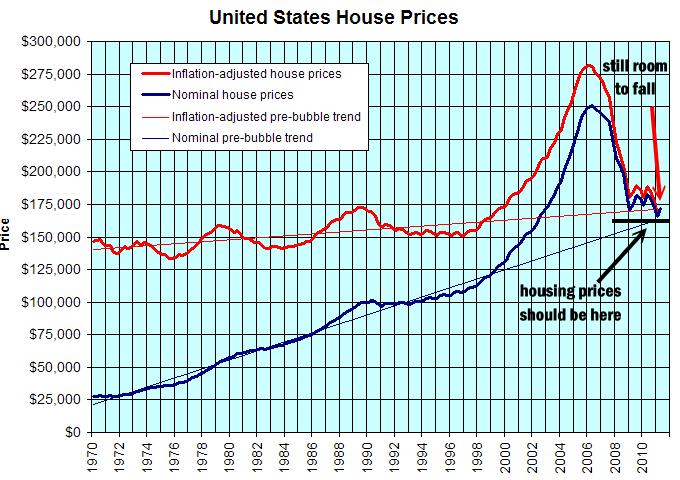
Analysts predict housing will continue to drop, but when you view a chart such as the United States House Prices below, it is obvious that there is still room in many cities for housing to return to a more “normal” level. Housing was obviously in a bubble which burst in mid-2006 and commenced the decline.
Therefore while cities like Detroit which have seen housing prices literally collapse and now see a rise in valuations, cities like Atlanta, Las Vegas and Phoenix are still seeing large declines because their pricing was so over-inflated in 2006 and still have room to fall to reach normal levels.

Inflation Adjusted housing prices show there is still room for prices to fall to reach normal levels.
Market Timing Indicators Show XLF Is In A Vicious Bear Market
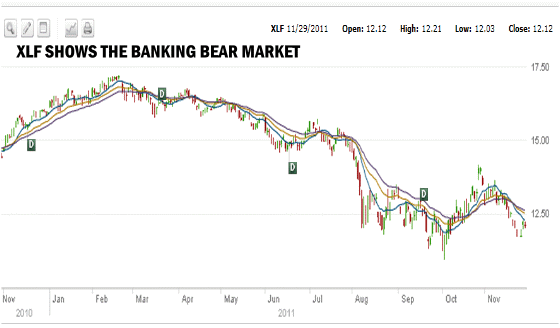
Market timing indicators can include the housing index and the house builders index, both of which are depressed. On top of those two indexes the banking sector is in a pro-longed bear market and market timing indicators show that there is no end in sight. The XLF index below shows the period from Nov 2010. While the chart is certainly depressing to look at, the 5 years chart further down the page is shocking.

Market Timing / Market Direction shows the banking sector is a bear market
Market Timing Indicators After 5 Years Of Losses Show No Recovery
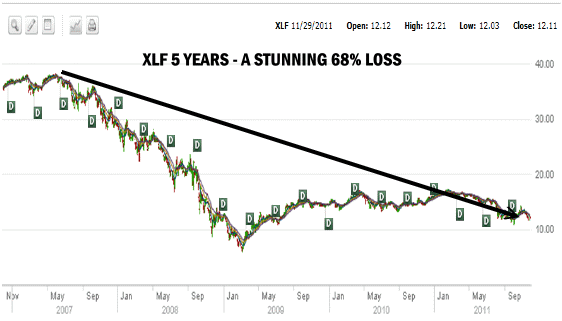
The 5 year XLF Index chart below shows a stunning 68% loss in valuations for the financial sector. This incredible bear market shows no signs of abating. Studying all long-term market timing indicators I can see no end to this bear market after 5 years. The hundreds of billions of dollars lost in share valuation and share holder capital is shocking and represents a serious obstacle for the market to overcome to change market direction to recover the 2007 stock market highs.

Market Timing / Market Direction shows a 68% loss in the banking sector over the past 5 years
Both of these areas of the economy, housing and banking must accept most of the blame for their own problems. Housing skyrocketed and banks refused to follow normal mortgage practices. Throughout much of housing’s bubble my market timing indicators stayed negative despite the housing run up in prices. On top of poor lending practices the financial services sector moved into areas of finance that had little to do with the core business of banking.
Last Month Market Timing Indicators Warned That Debt Repayments Were Stalling
In October, my market timing indicators for debt levels kept flashing that debt repayments in Canada and the US were stalling. The last chart is from the latest Federal Reserve minutes which confirms that overall American debt which was declining, has in the past month stalled. This has occurred in the past without serious repercussions and hopefully as in the past this is just a short-term stalling before more debt is repaid. Their chart below, shows the enormous debt growth which occurred starting in 2007. Select this market timing link to go to the Fed Governors Site.

Market Timing Shows Markets UNDER PRESSURE
Market Timing Shows Concerns
Market Direction Shows Bearish Pressures
To close, until there is a solid recovery in both of these sectors stocks will remain under pressure and I believe rallies have to be sold into. Market direction since the recovery from the 2009 March lows have continually shown stocks to be under pressure. Market timing since March 2009 has never shown strong overwhelming signals of another strong upward movement that would last the better part of a year. Instead market timing has since May 2010, reflected a choppy market with higher volatility and shorter term up trends.
I think both of these indices along with unemployment make the best case for continuing with conservative strategies of put selling and in the money covered calls coupled with some form of hedge such as the spy put hedge I use.
I prefer a conservative return in a market such as this as it should be obvious to most investors that stocks themselves could easily fall lower in the event that global economic events worsen and the US economy slows further.
Long Term Market Timing Indicators Have Remained Neutral to Bias Since May 2010
Market timing since May 2010, when taking into account both housing and banking constantly warns that the stock market direction will remain under pressure and will probably have more chances in the future of falling rather than recovering the 2007 market highs.
