FullyInformed.com

Market Timing / Market Direction Spy Put Trade Back On

Feb 15, 2012 | SPY ETF Hedge Strategy (SPY), Stock Market Outlook

Just yesterday I closed my SPY PUT trade selling my last 10 spy put contracts for the same price I bought them at. I explained in an article what I saw within my market timing indicators that told me not to worry about hedging my portfolio. Sometimes though you have to realize you might be wrong.

As today’s trading wore on my market timing indicators kept flashing that the market direction was indeed going to change and that my original outlook was probably right. The market direction is stalling.

It looks like the market is going to retest 1300 on the S&P. This could be an important test to determine if there is enough support to push the S&P 500 higher.

Here Is What Concerned Me

Below is the trading day today. There was a slight rise in the S&P 500 by noon and then a gradual selling. I saw the oversold indicator in the ultimate oscillator which started around 12:30 PM, but the bounce was poor and there was no overbought indication throughout the day. I bought 10 spy put contracts around 2:40 PM. If there was an interest in buying stocks by large investors there should have been a strong rebound and an overbought indication from the ultimate oscillator market timing indicator. There wasn’t.
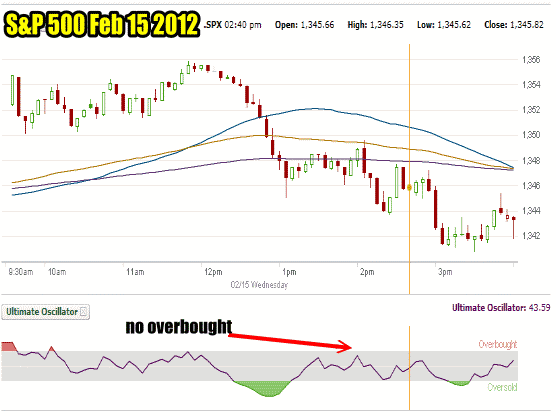
Market Timing / Market Direction chart for S&P 500 for Feb 15 2012

Market Timing / Market Direction chart for S&P 500 for Feb 15 2012

I felt that the 10 spy put contracts I bought basically replaced the 10 that I had closed yesterday. I figure I can hold until the loss is around $700.00 on my spy put contracts.

There are other indicators as well. The US Dollar is starting to rise again. The Euro is falling. This goes directly back to the problem within the European Union and Greece.

VIX Chart Flashing Warnings

There is also this VIX chart from Feb 9 to Feb 15. The VIX chart indicates that volatility is not subsiding. On Friday volatility reached 21.98. The supposed good news on the weekend helped push volatility lower but two days later it is back climbing and today twice the VIX pulled back only to see volatility continue to climb even higher. This quick rebound in the VIX did not occur last week.
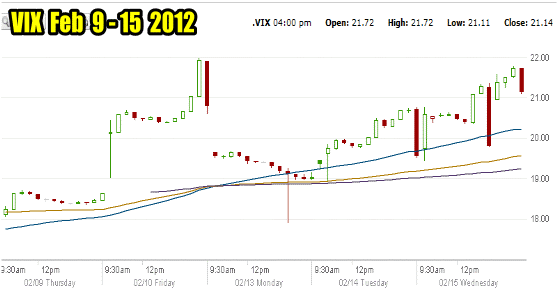
Market Timing / Market Direction VIX CHART

The VIX Chart for Feb 9 to Feb 12 Shows The Inability of Volatility to Subside


Market Timing / Market Direction Indicators

Here are my market timing indicators for Feb 15 2012 and their prediction of market direction.

The market timing indicator, momentum is positive although the reading of 101.45 is lower than yesterday, but it is still higher than Feb 1 and Feb 2. If it turns negative than I believe the market will definitely test the S&P 500 1300 level. A positive test of 1300 will prove beneficial to the market moving higher.

MACD (Moving Average Convergence / Divergence) is now negative. Weakness will definitely enter the market tomorrow or the next day. As long as the market holds 1300 the bull is still around.

The ultimate oscillator, my favorite market timing indicator is now down to 60.76. This is a big drop from yesterday’s 72.59 and last week’s readings of over 80. The overbought condition in the S&P 500 is over. The question now will be whether the pullback is small or large from here. Today’s drop from 72.59 to 60.76 is large enough to indicate that the next move down could be larger than expected.

Two days ago the rate of change was 3.00. With the selling in the last half hour of today’s trading the rate of change has fallen to 1.33. It is still positive but also pointing to a move for the market lower.

Both the slow and fast stochastic market timing indicators are lower from their recent extreme readings above 95. However they will have to move lower still before the market can bounce back up. This also would indicate that there will be more selling ahead.
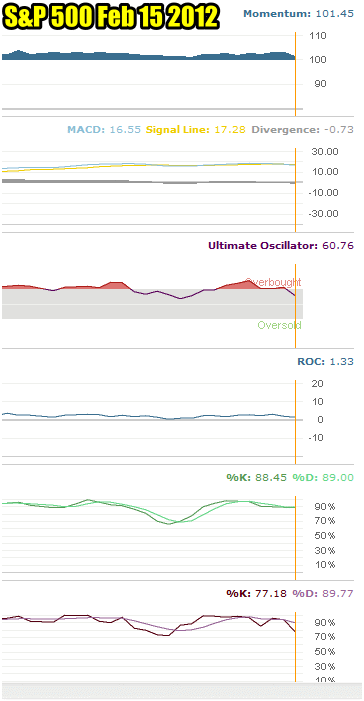
Market Timing / Market Direction Indicators For Feb 15 2012


Market Timing / Market Direction SPY PUT Trade Summary

I calculate that to hedge my portfolio I can hold for about a $700 loss which is roughly what I made earlier this week with the original spy put trade.

There is enough uncertainty in the market to warrant my putting back in place my SPY PUT Hedge for the moment. The market timing indicators are warning me that my original prediction might in fact have been correct. One of the most telling signs of a possible short-term top remains the amount of overall bullishness. The February effect is well-known. It has been the worst month of the spring period for 16 of the last 20 years. In the last 5 years the expiration week of February has been down. While certainly not a market timing indicator, these statistics cannot be ignored. It will be interesting to see what the rest of this week brings to the stock market.

Select This Link To View Today’s SPY PUT Trade

Search

Select to view all results...

Generic selectors
Exact matches only
Search in title
Search in content
Post Type Selectors

Recent Outlooks

Morning Investing Strategy Notes for Thu Nov 21 2024

For FullyInformed Members the morning Investing Strategy Notes for Thu Nov 21 2024 review the outlook now that we have earnings from NVIDIA, Palo Alto Networks, and others. Stocks discussed include NVIDIA Stock (NVDA), TQQQ, Snowflake Stock (SNOW), Palo Alto …

Stock Market Outlook for Thu Nov 21 2024 – Dip Likely Possible Lower Close

Prior Trading Day Summary: Wednesday saw another wild ride with the index opening and falling thanks in large part to stunning poor quarterly earnings from Target. It’s stock fell a staggering $33.16 for a loss of 21.41%. The stock closed …

SPY ETF Hedge Trades And Intraday Market Updates For Wed Nov 20 2024

Here are the SPY ETF Hedge Portfolio opening trade notes for Wed Nov 20 2024 following another choppy trading on Tuesday but again, a higher close. The support and resistance levels for today are slightly modified. I take profits as …

Morning Investing Strategy Notes for Wed Nov 20 2024

For FullyInformed Members the morning Investing Strategy Notes for Wed Nov 20 2024 review the outlook with a new confirmed down signal but other signals advising stocks could move higher. Stocks discussed today include Target Stock (TGT), NVIDIA Stock (NVDA), …

Stock Market Outlook for Wed Nov 20 2024 – Confirmed MACD Down Signal and NVIDIA

Prior Trading Day Summary: Tuesday saw markets open lower as investors fretted over the chance of an expanding Ukraine-Russia war. The Russian dictator threatened nuclear weapons while most analysts felt the danger was slim to none that any would be …

SPY ETF Hedge Trades And Intraday Market Updates For Tue Nov 19 2024

Here are the SPY ETF Hedge Portfolio opening trade notes for Tue Nov 19 2024 following a choppy day of trading Monday but a higher close. The support and resistance levels for today are slightly modified. I take profits as …

Morning Investing Strategy Notes for Tue Nov 19 2024

For FullyInformed Members the morning Investing Strategy Notes for Tue Nov 19 2024 review the outlook for stocks on Tuesday after the new technical down signal on Monday. There are a number of stocks discussed today including Applied Materials Stock …

Stock Market Outlook for Tue Nov 19 2024 – Unconfirmed MACD Down Signal

Prior Trading Day Summary: Monday saw continued pressure on stocks and a bounce attempt. The S&P traded 4.1 billion shares with 62% of all volume being traded higher and 57% of stocks advancing. The day ended with a 23 point …

SPY ETF Hedge Trades And Intraday Market Updates For Mon Nov 18 2024

Here are the SPY ETF Hedge Portfolio opening trade notes for Mon Nov 18 2024 following a lower day on Friday and a steep decline. The support and resistance levels for today are changed. I take profits as they appear, …

Morning Investing Strategy Notes for Mon Nov 18 2024

For FullyInformed Members the morning Investing Strategy Notes for Mon Nov 18 2024 review the outlook for stocks following Friday’s drop and the loss for the week. There are a number of stocks discussed today including Applied Materials Stock (AMAT), …

Stock Market Outlook for Mon Nov 18 2024 – Choppy – Possible Bounce Attempt

Prior Trading Day Summary: For Friday semiconductor stocks were leading the markets lower. By the close the S&P was down 78 points to 5870. For the week the index lost 125 points as the post-election rally came to an end …

Morning Investing Strategy Notes for Fri Nov 15 2024

For FullyInformed Members the morning Investing Strategy Notes for Fri Nov 15 2024 review the outlook for stocks following a lower close on Thursday. There are a number of stocks discussed today including Walt Disney Stock (DIS), Applied Materials Stock …

Stock Market Outlook for Fri Nov 15 2024 – Choppy With Bias Lower

Prior Trading Day Summary: For Thursday I had expected the index to dip a bit deeper than previous but to recover and close flat to higher. Instead the index slipped lower especially with comments from Fed Chair Powell that were …

SPY ETF Hedge Trades And Intraday Market Updates For Thu Nov 14 2024

Here are the SPY ETF Hedge Portfolio opening trade notes for Thu Nov 14 2024 following a choppy day of trading on Wednesday and a flat close. The support and resistance levels for today are unchanged. I take profits as …

Subscribe For The Latest News