 Talk about being spanked! I went to bed last night pretty convinced we would see more selling but instead investors decided they like the news about Greece and decided to rally. As the day wore on my market timing indicators turned slightly more positive. The market timing indicators didn’t go roaring green or anything, but they do seem to be indicating that the selling from a couple of days ago might have been a knee-jerk reaction and not the selling I had anticipated.
Personally if I was going on instinct I would still be holding my spy puts because I just don’t buy into this two-day rally after the selling on Tuesday but Bull markets are at times pretty mysterious and they will go on a lot longer than short sellers can stand. I have to follow the market timing indicators because without them I am just guessing. Today’s news about Greece mixed with yesterday’s news on unemployment was obviously enough for a two-day rally.
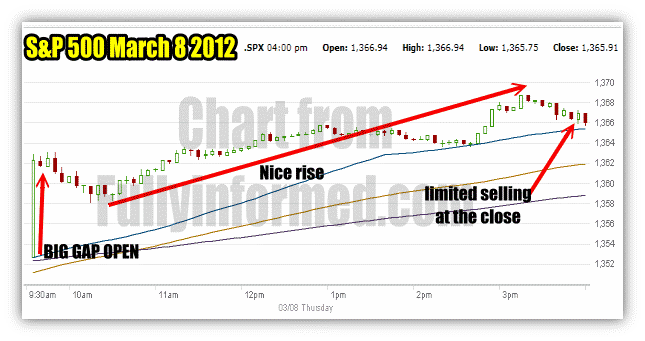
Today’s S&P 500 chart looks a lot better than yesterday’s.

S&P 500 Market Direction Was Strong All Day. Limited Selling Into The Close
Market Timing / Market Direction Indicators
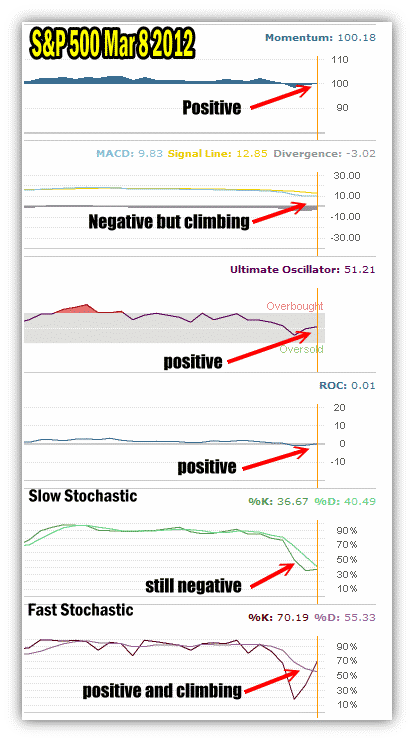
My market timing indicators today are definitely more positive. They are not raging upbeat, but there are more positive than negative which would seem to indicate that the market direction is neutral to up. My market timing indicators are now trying to climb back to positive.
Momentum is just slightly positive. MACD is still negative but climbing back from the past few days of selling. The Ultimate Oscillator, my favorite market timing tool is back positive again and sitting squarely in neutral territory. Rate Of Change is positive but so slight that it really is neutral. The slow stochastic is taking it’s time turning positive and instead is staying neutral on the rally.
The last market timing indicator is also the most telling. It has turned decidedly positive with its reading.

Market Timing Indicators For March 8 2012 are more positive after two days into the rally.
Market Timing Indicators Have Turned Positive But ….
Alright so the bull trashed yesterday’s market timing column. I can take it. I am old and the market has beaten me up plenty of times. This one was just a minor setback and certainly I lost little in the way of capital by closing my puts today. But the market is actually neutral to the rally. The only positive light is the Fast Stochastic which is up strongly over two days. The Ultimate Oscillator is doing its best to support the Fast Stochastic signal and perhaps those two will be right. However the rest of the indicators are not convinced that the rally will hold. They need a little more convincing.
Despite what my instincts tell me, I closed my SPY PUT hedge late in the afternoon as too many of the market timing indicators were climbing back positive. I am not sure we will rally higher yet, because certainly after two days of a big rebound there should be some neutral action. However the 5% decline I felt we could see may end up being the 2% we just saw!
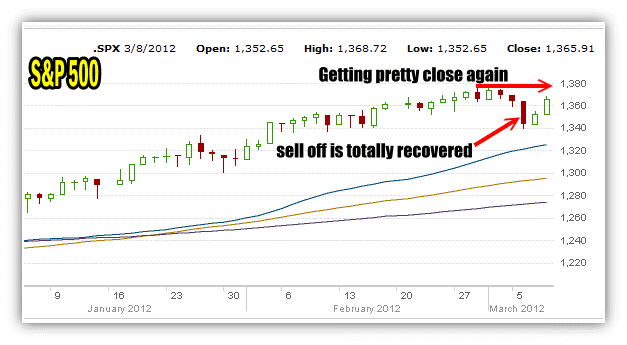
Tuesday’s Selloff Is Recovered
The selloff from Tuesday is completely recovered and the S&P 500 is once again pushing back toward the highs and into heavier resistance. This time however there is no overbought condition to contend with. This could mean the S&P 500 might break through resistance.

Tuesday’s Selloff Is Completely Recovered
Russell 2000 Market Timing Indicators
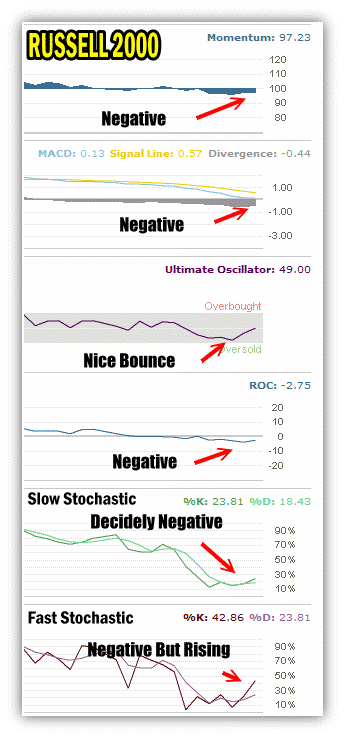
To conclude tonight’s view of the market I want to look at the Russell 2000 which is a good broad spectrum of the overall small cap market. Since mid February the Russell 2000 has not been able to set new highs. Often the Russell is a great place to look when market timing indicators on the rest of the stock markets are mixed.
The market timing indicators for the Russell 2000 are far less bullish as you can see in the chart below.

Market Timing Indicators On The Russell 2000 are less bullish
Market Timing / Market Direction Summary For March 8 2012
Overall the S&P 500 market timing indicators are looking a bit better but before they will call for a resumption of the market direction higher, they want to see more proof. Two days of solid gains has not turned the readings as positive as I would have thought. Meanwhile the Russell 2000 readings are still negative. Again the two market timing indicators that might hold the clue are the Fast Stochastic and the Ultimate Oscillator as both have turned up and had a very nice bounce from Tuesday’s selling.
So there you have it. More evidence is needed before the market timing indicators will give a full steam ahead signal. Meanwhile my spy put hedge trade ended in a loss. I do think more selling is ahead but unless the timing indicators can get a lot more bearish the selling may simply retest Tuesday’s low and as you can tell from my SPY PUT hedge on Tuesday, there wasn’t a lot of money to be made on that day either.
My spy put hedge is for protection and not a profit trade. Just as in last month, I once more see limited downside and no real concern to hold my spy put trade longer. If the market direction should turn decidedly negative I will have lots of opportunity to put the spy put hedge back in play. However with the bulls in charge and my market timing indicators close to positive, the chance of a bigger pullback to 1300 is probably not going to happen overnight if at all.
One nice thing about Tuesday’s selling is it brought some good put premiums into my portfolio but overall I had hoped for a lot more.
