Market timing is two parts, one is technical and the other is fundamental. The market timing technical readings I did on the weekend of April 1 did not show cause for concern over market direction although as I indicated in that market timing column, there were definite signs that the market direction was seeing hesitation on the part of investors. The market timing fundamental side therefore indicated that with hesitation comes concern and that concern only needs a catalyst to get investors selling.
It started on Tuesday with Fed minutes pointing out that the economy was improving and at this stage the federal reserve saw no need to further stimulus. That was the market timing fundamental indicator that got the market direction to change.On Wednesday a second fundamental reason entered with the news of the poor Spanish bond results.
It is important to understand that investors truly do not care about the economy. They care about making money and when the federal reserve dumps in hundreds of billions of dollars as it has done since late 2008, investors are thrilled to have asset classes artificially inflated. What’s not to like? Market manipulation has gone on since before the Roman Empire. See my article Market Manipulation, You Bet.
The news though that the Fed feels the economy could be finally improving worried many investors as it could mean the party of zero interest rates and stimulus money is drawing to a conclusion. See my article Dance Near The Exit. This won’t happen overnight but in my market timing column last week I mentioned how each rally since January had seen a decent number of trading sessions before weakness and dip buyers set in, where the last couple of rallies lasted only two days before selling returned. This is obviously a sign of a market in trouble.
Before looking at the S&P 500 let’s look at my market timing technical indicators for the last two trading sessions of last week.
Market Timing / Market Direction Technical Indicators
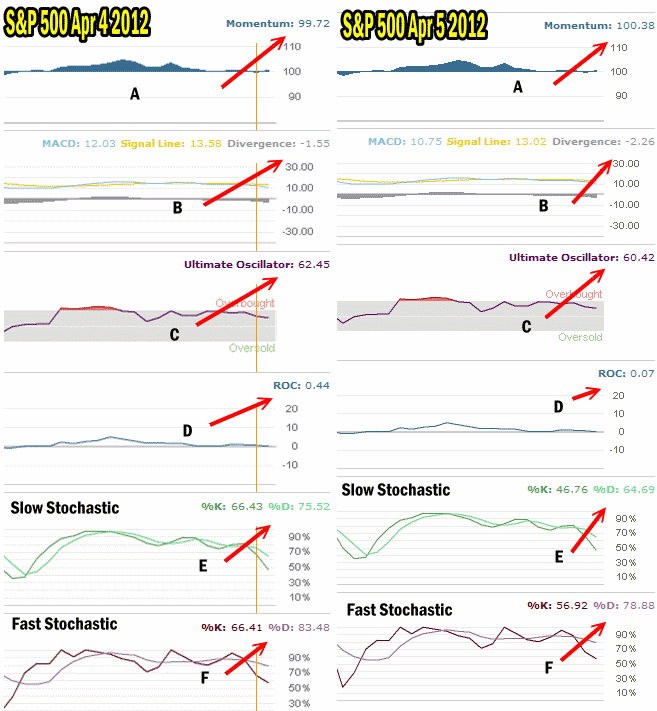
I have shown below the last two trading sessions of Wednesday and for Thursday April 5 before the Good Friday break in the market.I have marked from A to F on the chart and explained below what each of these market timing technical tools are signalling.
A) Momentum is up slightly from Wednesday’s selling. On Wednesday with Spain back in the news investors were nervous and were back selling their stocks. However on Thursday a few brave souls were buying stocks and this pushed momentum up slightly. Overall though it is a neutral reading.
B) MACD is probably the best market timing indicator to use here. The MACD Histogram shows that the market is going to move lower. Thursday’s reading was considerably lower than Wednesday’s reading. There is no doubt in my mind that MACD is showing a clear direction change coming for next week.
C) Ultimate Oscillator reading for the last two trading days is continuing to decline which supports what MACD is warning.
D) Rate of Change is now falling rapidly and again signals that the market will move lower next week.
E) The Slow Stochastic is falling again indicating a falling market.
F) The Fast Stochastic is also declining which supports what the other market timing indicators are saying, the market will move lower from here.

Market Timing / Market Direction Technical Indicators For April 4 and 5 2012
How Low Will The S&P 500 Fall?
The question now is how low can the S&P 500 fall from here?
On Wednesday evening April 4 I sent out an email to email subscribers, explaining my stance on the recent selling in the market. I was busy with a number of trades and did not have a chance to update anything except my SPY Put trade. But I felt that the market should be due for a bounce on Thursday based on a number of factors including historical data from previous years for the day prior to Good Friday.
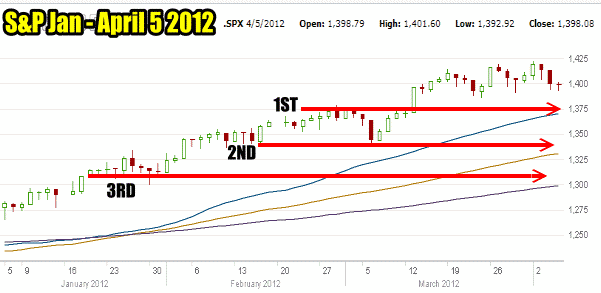
That bounce did not really happen although selling was muted in the market on Thursday April 5. If you look at the chart below you can see the stairway steps I have mentioned in previous market timing / market direction columns. Basically every step has seen 3 days of selling, dip buyers step in and push the market back up.
However you can see a distinct double top in the S&P in the chart below. Whether this is a sign of the market topping action remains to be confirmed but the more important aspect is whether the 3 down trading sessions now comes to an end. If there is more selling on Monday than this most recent rally which has been spectacular since January, has concluded and we should see a decent pullback from here.
Looking at the S&P chart below I have pointed 3 levels which I believe the S&P 500 has some support at. The first at 1375 I think the S&P 500 will definitely reach. The second is around 1350 and I believe that is where firmer support rests and we could see the market move sideways at that point.
If that breaks, then the 3rd line is around 1310 to 1320. That marks a very strong retrenchment and I would not anticipate that happening at this stage. Naturally, if that breaks than the recent rally from Nov 25 low could easily be wiped out.

Market Timing the S&P 500 for April 5 2012
Market Timing / Market Direction Summary and Put Selling Going Forward
It’s obvious to me that even if we have a bounce on Tuesday or even Wednesday, I will be purchasing SPY PUTs at some point as there is enough momentum now in the market that it will move lower. Selling will continue next week until the market reaches the first level of support at 1375. Then we will get to see how strong the bears are and if they can push the S&P lower by another 25 points.
This is why put selling is such a great strategy. I never worry about my big cap stocks and look for opportunity in every pullback. Put selling investors have complained that put premiums were drying up, as volatility decreased. Now volatility will increase. The question for many put selling investors will be if they are willing to risk their capital at this stage of a sell-off.
I believe taking small positions in my favorite stocks is a great strategy. I started this on Tuesday and Wednesday of last week and I will be continuing as the market moves lower. Every sell-off is an opportunity. For those put selling investors who NEVER want to own the underlying stock it is obviously prudent to wait to see if the market can hold at the first or even second support level before put selling again.
I have a lot of faith in the stocks that I sell puts against. Through selling small groupings of puts as some fall I continue to earn income, and if assigned shares I know I am at reduced valuations. I am not expect a plunge in stocks at this level. The jobs figures on Friday were poor to say the least but the economy is still growing slightly. Anyone who thought this latest recession would end rapidly is definitely mistaken. I had written back in 2008 that I believed the economy could grind along for probably 10 years or even more before showing substantial gains from this recession.
The stock markets are definitely ahead of themselves, but there is always opportunity for those of us who enjoy put selling and using the SPY PUT Hedge to protect against a major calamity. For investors who buy and sell puts instead of basically shorting them (which is what put selling is), a rally on Monday morning could be a great chance to buy SPY PUTS or POWERSHARES or even the Bear Inverse ETFs to ride this move down.
The only way the market direction can continue up is for the market to recover and push to new highs and do this over a period of more than just two or three days. The market must see a move higher that lasts for 7 or more days before more selling enters. At this stage in the present rally I do not believe the market can accomplish this. It is a rare event in the past for such a rally to continue with a strong sell-off to shake out some investors and bring out the doom and gloom talking heads on TV and the web.
With the market direction now changed and confirmed by my market timing indicators I will be watching constantly for opportunities to do put selling and waiting for the next rally in stocks which could start in as soon as a few weeks or be as late as the summer or even into the fall.
