Market Timing indicators often give a simple and clear signal. Today was a good example. With the news from Congress finally agreeing with President Obama’s tax-cut extension and data for November durable goods orders rising the most in four months, stocks on Friday were in a holiday spirit. Personally I wondered if it was the fact that Congress is finally leaving for a few weeks and perhaps they cannot “screw” things up more than they have already done for at least a few weeks.
At any rate, all my market timing indicators have all turned solidly positive. Let’s take a look at Friday’s action and see what it means for market direction for next week.
Market Timing / Market Direction Technicals For Dec 23 2011
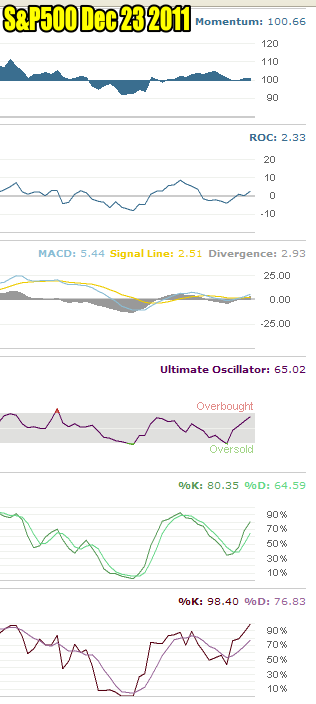
I have added the market timing momentum indicator to show that it is back on the positive side. While not as high as previous sessions this week, much of the weakness can be linked to the light volume due to the Christmas season. However it is still positive and that is what is important.
The Rate Of Change market timing indicator is solidly positive with a reading of 2.33 telling us that market direction is up.
MACD (Moving Average Convergence / Divergence) market timing indicator is also positive with a reading of 2.93. This market timing indicator is often among the first to warn of problems. Readers who follow my market timing calls probably remember a number of times when I mentioned that MACD has not supported the rally OR is warning of a change in market direction. Select this market timing link to understand more about MACD.
The Ultimate Oscillator market timing indicator is not over-bought but another day like today and it will be. Remember though that an over-bought market can push higher to the upside than investors expect so an over-bought reading in a rally is not unexpected.
Both the slow and fast stochastic market timing indicators are positive and confirming the rally will continue into the first session of next week.

Market Timing / Market Direction Indicators For Dec 23 2011 show that the Santa Claus Rally is already underway.
Market Timing / Market Direction Santa Has Come To Town
In the last few half hour of trading on Friday the market pushed a lot higher and closed on the highs of the day. Today’s candlestick is a white opening Marubozu which again shows that the market opened higher than the previous day and pushed prices up all day closing at the high. This is a bullish sign for the market.
The Santa Claus rally comprises the days between Christmas and New Years and the first two days of January. There is a belief among investors that if there is no Santa Claus Rally than the bears will control the markets. While there are lost of statistics to back one side or the other, I have followed the Santa Claus Rally over the past 35 years of trading and it’s a myth.
However the returns from the Santa Claus rally can at times be impressive as investors jump in as the market climbs. However watch for the third week of January which over the past 35 years has not been too kind to investors.
With all the market timing indicators showing market direction up, I would treat this as a nice rally in the bear market we are stuck in. Until the S&P recovers the Oct 27 2011 high of 1292 level and then breaks the 1370 of May 2 2011, we are in a bear market.
With that in mind I have been using my market timing indicators to time me when the rallies are ending in order to sell covered calls and again to tell me when the selling is slowing, to sell puts. That will remain my strategy until the market confirms new highs and once again forms another bull phase in what is definitely a secular bear market.
