Market timing indicators are lagging indicators in that they are looking at past events to predict future events. Today would be a good example. With the biggest one day gain since Nov 30, you would think my market timing indicators would be all rosy and positive and pointing to a market direction back up. But in fact only one indicator is giving the rally a green light. The rest of the market timing indicators are all still on caution and are not as positive as the rally on November 30.
Market Timing Indicators Have Improved But…
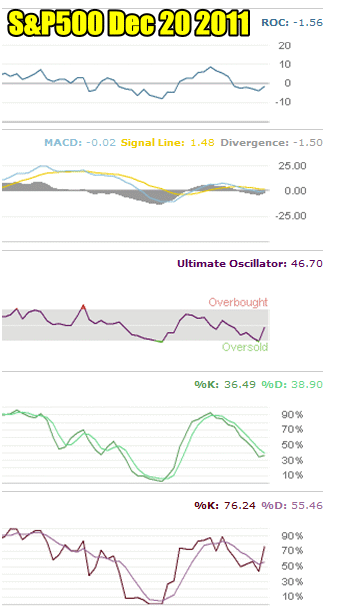
Today’s market timing indicators have improved over yesterday’s but that is to be expected. However only fast stochastic is giving a thumbs up to today’s rally and indicating that the market direction has changed.
The Rate of Change Market Timing indicator remains negative at -1.56. On November 30 the rally saw the rate of change move from negative to positive. Today’s rate of change saw a rise, but it will take at least another green day for the rate of change market timing indicator to turn positive and confirm a market direction change.
MACD is much better at -1.50 in relation to both yesterday and the big rally of November 30, so that is a good sign. One more green day and it too should turn positive.
The Ultimate Oscillator which I believe to be one of the best market timing indicators is not positive but with a reading of 46.70 it is close. However when you look at the chart you can see that it shows the market today bounced off an oversold technical condition which is part of the reason for today’s big jump. Until it turns positive there is no confirmation of a market direction change.
Slow Stochastic is negative at 38.90 but it is turning up after today.
It is the last market timing indicator, the Fast Stochastic that is now positive again and in a somewhat big way. It is signalling that this rally could last a few days.

Market Timing / Market Direction for Dec 20 2011 shows that a follow through day is needed to confirm the market direction has changed back to up.
Market Timing Indicators Need A Follow Through Day
The market timing indicators as a group need a follow through day in order to remove the possibility of this being just a technical bounce and confirm that the market direction is up.
Candlestick Market Timing Indicator
Today’s candlestick is known as a white opening marubozu. It shows that the market opened higher than the previous day, rose throughout the day but failed to close at the high of the day. Often this means “nice rally, but we need to see a follow through”.
S&P Chart For Dec 20 2011
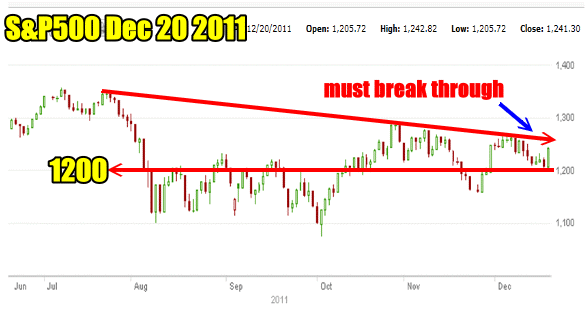
Below is today’s S&P500 chart and you can see how yesterday the S&P came close to the 1200 level which has provided support in the recent selling and today bounced off that support. Select this market timing link to read more about the Santa Claus rally effect.
For the S&P500 to prove this is more than just a bounce, it must break through resistance at 1267 and then 1292 to change the pattern of lower highs and confirm market direction is up.

Market Timing / Market Direction S&P500 chart for Dec 20 2011
All I Want For Christmas
There are some good signs in the market. A number of stocks continue to set new highs despite the market weakness. As well the 1200 level in the S&P500 held in the recent selling and today bounced off it. However with just one market timing indicator turning positive we need at least two more market timing indicators going positive to tell us that the market direction is changed and confirm that perhaps Santa indeed is finally coming to town.
