What I love most about market timing is using the same indicators each day to judge market direction to begin to spot trends and warning signs. Back in the 1970’s when I started investing, many of the market timing indicators in use today to predict market direction were not available. Most of my market timing back them was done by using the moving averages, in particular the 10 day simple moving average with the 20 and 30 day exponential moving average. These market timing indicators could be combined with the 40 day weighted moving average to give a reasonable prediction for market direction.
Today there are better market timing indicators which can help every investor in having some idea about market direction. Many of these indicators can also be applied to individual stocks but since most stocks follow the overall market direction, most analysts apply these market timing indicators to the major stock market indices instead.
I always recommend to investors that they check at least 4 indicators every day and review them against the previous days.
Market Timing / Market Direction Indicators For Dec 5 2011
One of the oldest market timing indicators are candlesticks. There are investors throughout the world who trade by nothing more than candlesticks and use them on both indexes and individual stocks, currency, commodities, ETFs, and a range of other financial products to judge market direction to enter and exit trades profitably. Candlesticks have been in use for centuries.
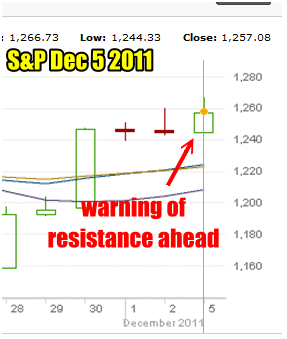
Today’s candlestick is referred to as a white candlestick bullish engulfing trend. Today’s closing candlestick is warning that the market is coming against resistance and needs to break out. For a buy signal to be given by candlesticks telling investors that the market direction is still up, the market tomorrow (Tues Dec 6) needs to open up higher than today’s close. If it opens higher, then a buy signal is issued. If it fails then the overhead resistance remains and investors need to wait for the candlestick from Tuesday’s session to determine market direction. That’s the theory behind the market timing candlestick indicator for Mon Dec 5.

Market Timing / Market Direction of the S&P for Dec 5 2011
My Market Timing / Market Direction Indicators
I thought I would throw the candlestick in there for today because once in a while I do refer to the day’s candlestick and I will try to more often give my interpretation of the day’s candlestick.
However below are my preferred market timing indicators for predicting market direction and they actually reflect the same stance as the candlestick, that the market is bumping into resistance and may have trouble moving higher.
Below are the main market timing indicators I use every day to review the market direction.

My Market Timing / Market Direction indicators for Dec 5 2011
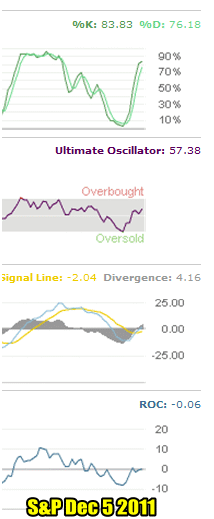
Each market timing indicator is listed below from top to bottom.
Market Timing Indicator Slow Stochastic (top indicator)
The slow stochastic is showing a market still moving higher but compared to yesterday, this market timing indicator is warning that the upward movement is running into resistance and market direction could be changing sideways. The stochastic indicators were created back in the 1950’s. To learn more about them select this market direction link.
Market Timing Indicator Ultimate Oscillator
As regular readers know the Ultimate Oscillator is my favorite market timing and stock timing indicator. It is climbing back into positive territory at a reading of 57.38 following yesterday’s reading, but it too is slowing down.
Market Timing Indicator MACD (Moving Average Convergence / Divergence)
Probably my second favorite indicator is MACD. With a divergence reading of 4.16 it continues to stay bullish and is not warning of any change in market direction. Select this market timing link to learn about MACD on Wikipedia.
Market Timing Indicator Rate Of Change (bottom indicator)
The last indicator is the Rate Of Change and it remains barely negative. It is still higher from yesterday but still negative. This means that the recent rally remains suspect despite the decent advance.
Market Timing / Market Direction Overall Summary For Dec 5 2011
Based on the above indicators including the candlesticks, the market is now into resistance and either it must break through or the rate of change indicator may be proven valid if the market direction pulls back. For me, when using these indicators I hold off any more put selling because if the market should pull back the volatility will climb higher and puts will grow in value.
For selling deep in the money covered calls to keep bringing in more cash and reduce cost basis in stock, these indicators could be telling me that this is a good time to consider moving my deep in the money calls from December to January as I may earn more premium on those deep in the money calls now, because if the market falls, call premiums will decrease.
This is how I use these market timing indicators when judging market direction and putting in place my strategies. Reviewing market timing indicators daily is just part of the importance of having a plan. It will be interesting to see Tuesday’s market direction and what the market timing indicators tell me at the close of Tuesday’s trading.
