Market Timing sometimes flashes warnings signs about a change in Market Direction a few sessions in advance. This could be the case for the recent past few sessions. Once market direction changed on October 4 and the market rapidly moved back to the 200 day moving average marking one of the best rallies in October since 1974 but also marking the best one month rally in years, market timing went negative as the markets remained heavily overbought.
The selling of the start of November has gone a long way to remove the overbought condition. Since then the market direction has been sideways. Throughout the October rise market timing refused to go positive, which is a clear signal that market timing is advising that this is a bear market rally. Remember that bear markets have breath-taking rallies and spine chilling falls. Through the strategy of the cautious bull I stayed invested but not through stocks only through put selling and in the money covered calls.
Market Timing Shows Signs Of Possible Rollover
While market timing warned throughout October that the move higher was a bear market rally, market direction has now turned sideways and market timing is advising that the market is on the verge of a possible rollover. So is a rollover a possibility or is the market just working out the overbought condition and preparing to move higher.
Here are the market charts.
Below is the S&P 500 from Dec 31 2010 to Nov 8 2011 as of this morning. The recent high is plotted and you can see that the recent high was tested several times in the past year. This means that the 1292 area will be fairly high resistance for the markets to break through. Another market timing indicator is the number of bears versus bulls. Presently there remains more bulls at 48% versus bears at $23% and the blog poll of blog sites shows that 40% are bullish and 30% are bearish with 30% being neutral.
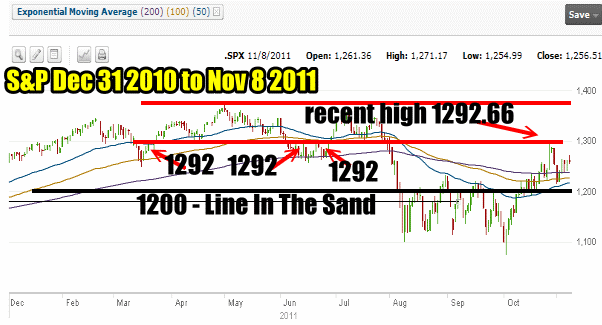
S&P500 Dec 31 2010 to Nov 8 2011 - Trying To Break Resistance Or Rollover In Progress?
Market Timing / Market Direction MACD Indicates Rollover Could Be Starting
While momentum although declining, remains positive and the ultimate oscillator shows sideways with a leaning to positive, it is MACD (Moving Average Convergence / Divergence) which for the past three sessions has remained negative and continues to be so today.
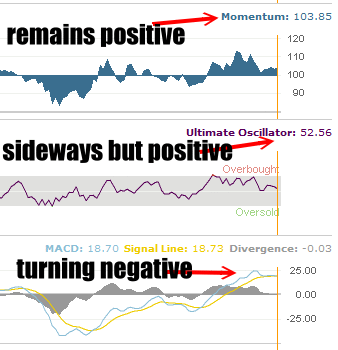
Market Timing / Market Direction Technicals Show Rollover Could Be Starting
Market Timing / Market Direction – The NASDAQ
The NASDAQ chart exhibits the same problem. The line in the sand for the NASDAQ is 2600 which has been support twice in the past year and was support in the selling back on November 1 2011. It appears that the NASDAQ may need to move back to test 2600 one more time.
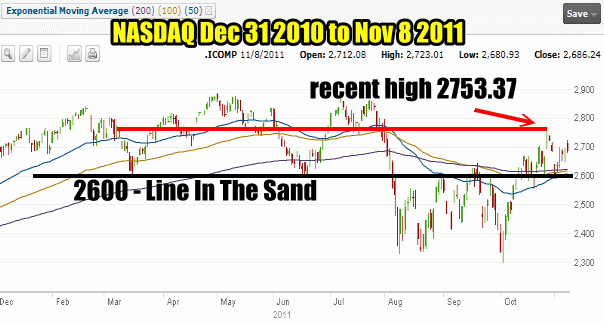
The NASDAQ for Dec 31 2010 to Nov 8 2011
Market Timing / Market Direction – NASDAQ Fundamentals
The NASDAQ fundamentals are similar to the S&P which supports the market timing warning of a possible rollover beginning. While Momentum and the Ultimate Oscillator remain positive, MACD (Moving Average Convergence / Divergence) turned negative three sessions ago and continues to build now reaching a negative 1.01 which is decidedly higher than MACD on the S&P.
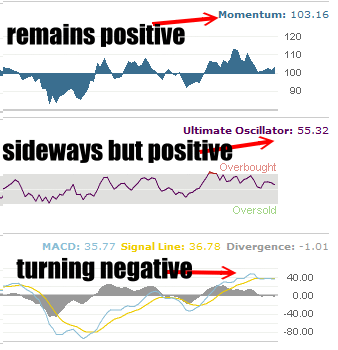
NASDAQ Fundamentals MACD Is Turning Negative
Market Timing / Market Direction – What The Above Charts Are Saying
I have said many times in the past that Market Timing is not a science but instead a predictor which at times is based on a number of factors including historic patterns and even instincts. Market direction looks negative on the NASDAQ and would show that the NASDAQ wants to return to the 2600 level to test for solid support before attempting to move higher. Any move lower in the NASDAQ would impact the S&P.
The S&P looks slightly better but would seem to want to pull back before attempting any move higher. So is the market direction on the verge of changing?
My Market Direction Outlook Into January 2012
My outlook for the next few months is for a bit of a rally into the Christmas period and then for selling to re-emerge in January. That’s my prediction and I have no technical tools that would support that prediction at this stage.
To help further I went to the Russell 2000 index (IWM). Select this Market Timing link to view the last 3 months on the Russell 2000.
Market Timing / Market Direction – The Russell 2000 Says Market Up
While the Russell 2000 has pulled back from its recent high in October (as have all the indexes), the mood here is much stronger. It remains entrenched on the 200 day moving average and the last 4 sessions of sideways movement continues to keep the Russell 2000 on the 200 day. This is a good sign. Should the Russell 2000 market direction change and it fall back to 70, my line in the sand, as long as it does not break through the market direction uptrend will remain.
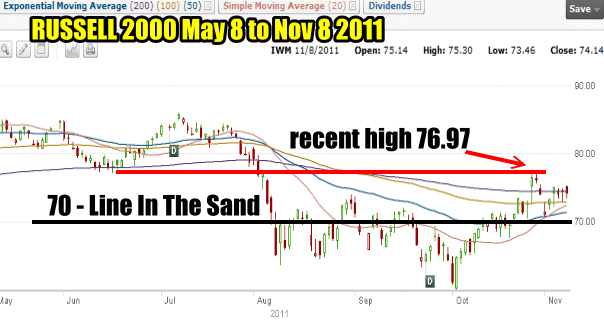
Russell 2000 is very much positive
Market Timing / Market Direction – Russell 2000 Technical Indicators
The last chart to look at are the Russell 2000 technicals which have been a great help for market timing through 2011. All the market timing indicators remain positive and my favorite market timing tool MACD is still positive although barely. Meanwhile the Ultimate Oscillator is indicating that the overbought condition of October is gone thanks to the sideways motion. RSI (Relative Strength Index) is positive which is another good sign. Momentum is lower but still quite positive.
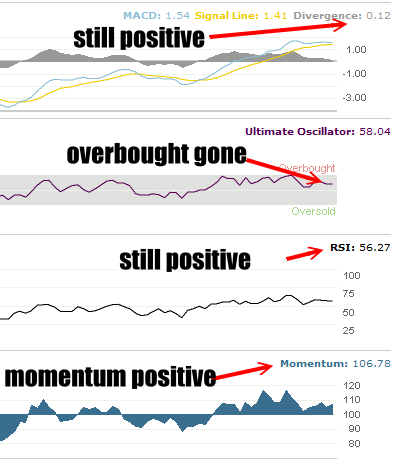
Russell 2000 Technicals Remain Positive
Market Timing / Market Direction Summary for November 8 2011
Although I am writing this at noon, my market timing indicators for the NASDAQ and the S&P remain warning that the market direction could be in for a rollover shortly. Meanwhile though the Russell 2000 which has been a very good market timing indicator is showing that while a rollover is a possibility, it is more likely that the market is simply working out the terrific October rally before setting itself up for a rally into the year-end.
With the market timing indicators remaining wary of the chance of any move higher I remain using the cautious bull strategy. I am continuing with my put selling trades and staying away from at the money puts. For any covered calls I am still in the money and I will remain there into 2012. Any market weakness and I will be back using my spy put hedge.
With the market timing warnings cannot be ignored and with the VIX hovering still around 30, it never hurts to remain prudent and be aware that the market direction could change here.
