Market timing doesn’t have to be difficult. Investors need to put their faith in their abilities rather than spend time second guessing. On March 12 in my Market Timing / Market Direction article I indicated that there was limited risk in the stock market right now. I based this on my market timing technical indicators which showed at that time fresh capital was making its way into the stock market and the chance of the market having a serious pullback was not being shown in the market timing indicators.
Market Timing Tools And Put Selling
Based on my market timing technical indicators I have continued with put selling and as premiums are decreasing with the lower volatility I am looking for weak moments in my favorite stocks to step up and do put selling. A good example has been my PepsiCo Stock trades which I mentioned in a number of recent articles. PepsiCo stock experienced some weakness and I took advantage to sell puts and buy some PepsiCo Stock.
Another example was Kraft Stock which leading up to their earnings announcement fell below $38.00 and made the $37 put very attractive. Bell Stock (BCE) is another good example as it fell below $40.00 and pushed up both the $39 and $40 puts allowing me to sell both puts.
Investors Continue To Buy The Dips
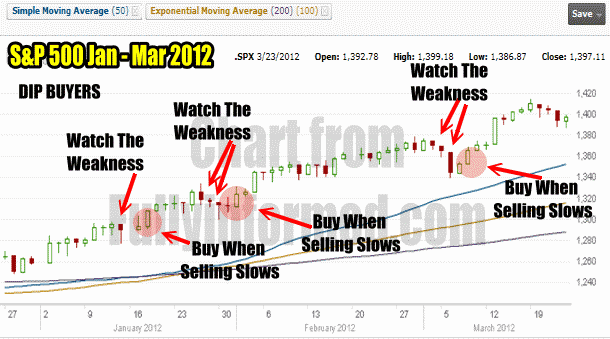
As long as the Stock market is being bought on dips there is very limited downside to market direction. The dip buying of the stock market is typical of a bull market. When the market becomes weaker, dip buyers step aside and watch for a couple of days to see how much selling might come to the market place. Once they determine that market direction is bottoming out and the sell volume is declining they step in and buy back their favorite equities for the next little push higher. These type of investors are professionals and know exactly what they are doing. The movement of the dip buyers is obvious in the chart below. As long as the dip buyers are still there the market direction is still up.

The Dip Buying Is Obvious Since December 2011
It’s a simple process that works very well in bull markets such as what we have seen since November 25. Every dip has been bought and the market then pushed higher. I can imagine the horror of short sellers who were convinced that the December rise after the Nov 25 fall, was going to be short-lived. Instead the market has risen dramatically and short sellers are trying to get out of the market at every sign of weakness.
Market Timing Indicators For Mar 23 2012
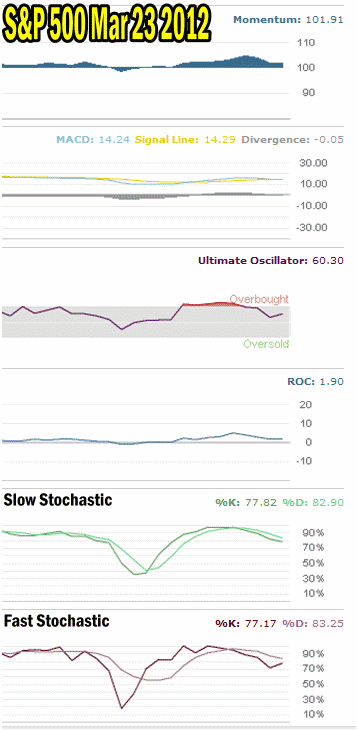
My market timing indicators for Friday show that the overbought condition has weakened considerably which should allow the market to now push higher. Momentum is still good at 101.91. MACD is just slightly negative but actually more neutral than negative.
My favorite market timing indicator, the Ultimate Oscillator is now down to 60.30 and already starting to turn back up on Friday. Rate of Change is still positive at 1.90 and despite the selling last week it hardly went negative at all. Again Rate of change was more neutral during the selling than negative.
Finally the Slow and Fast stochastic market timing technical tools are both indicating that the overbought condition is gone and both have strong signals indicating there is strength in the market.

Market Timing / Market Direction Technical Indicators For March 23 2012
Market Timing / Market Direction Outlook For Week Of March 26
I keep a list of my favorite stocks beside my computer. I look at them in the morning, around noon hour and into the afternoon just before closing. Based on my market timing indicators I use any sign of weakness in my favorite stocks as an opportunity to sell puts.
I believe there is no point in listening to the endless parade of analysts on the TV or the Internet. Instead put in place market timing tools, learn then, watch them and interpret them. The dip buying is indicative of a bull market. It could end at any time but until it does the market direction remains intact.
Overall my market timing tools remain unconcerned about the market direction moving lower, which tells me that weakness has to be used for put selling as overall higher stock prices are probably coming soon.
