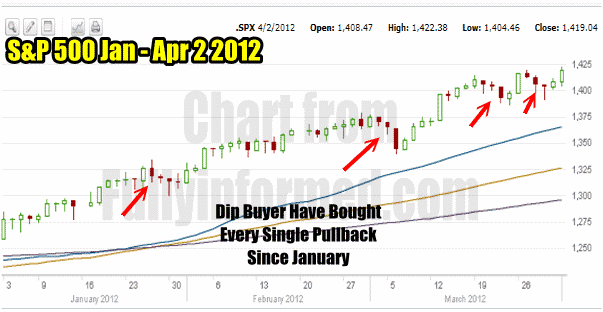
Market timing for the first week of April continues to show a positive market direction. The typical dip buyers picked up the market after the 3rd down trading session just as in the past. I discussed this pattern in my most recent market timing columns. The market timing technical analysis although certainly not bearish by any stretch are presenting a few warning signs but nothing that would indicate great concern on my part at this stage of the rally. Simply put, the market direction remains up and here is why.
Some statistics that are worth mentioning include that the first trading day of April has been positive in 14 of the last 17 years according to the Trader’s Almanac. They also indicate that April is the best month for the DOW since 1950! On average the DOW has gained 2% for the month of April over the past 61 years which is indeed an impressive figure.
This is a short week and again according to the Trader’s Almanac the NASDAQ has been positive for 11 years straight and on the Thursday before Friday it has been up 15 of the past 17 years.
In the S&P 500 chart below you can see the Dip Buyers in action.

This market timing / market direction chart shows that every dip has been bought by traders since January 2012.
Market Timing / Market Direction Indicators for April 2 2012
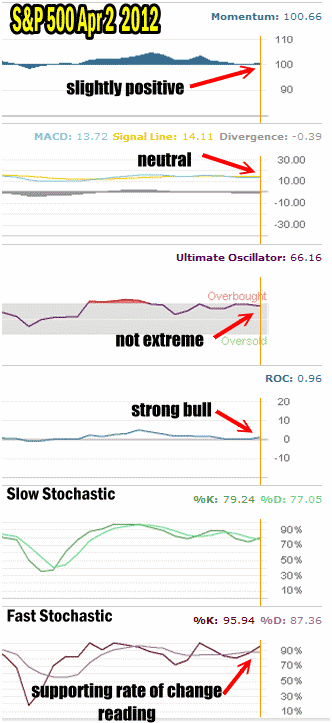
My market timing chart is below and while no where is there any bearishness, there are a couple of signs that I am watching.
Momentum market timing indicator is only slightly positive despite today’s action. Should this slip lower it would indicate hesitation on the part of traders and a possible challenge to the ongoing market direction trend.
MACD (Moving Average Convergence / Divergence) is still slightly negative but truly more flat than anything.
My favorite market timing technical indicator the Ultimate Oscillator is bouncing off the overbought condition but it is nowhere near extreme overbought by any stretch which means there is still more room to the upside for this market this week.
The market timing indicator, rate of change, is flashing a big advance as it has moved from basically neutral to a very positive 0.96 which is a strong recovery from Friday.
The slow stochastic market timing technical tool is turning back up and again not overly bullish which is a good sign, with a reading of 77.03 however the fast stochastic is strongly bullish with a reading of 87.36 and a strong turn higher.

My market timing indicators at the close of trading for April 2 2012 support the market direction continuing to move higher. There are though some signs of hesitation on the part of traders.
Market Timing / Market Direction Summary For April 2 2012
The day after April Fool’s Day has added another positive year to the Trader’s Almanac reading of the first day of April trading being strongly bullish.
Rate of change is the most telling market timing indicator at today’s close with a very strong rise. That market timing indicator is being supported by first the Slow Stochastic which has a very solid bull reading and secondly by the Ultimate Oscillator which shows there is still strength in the market.
While momentum is basically neutral, MACD is warning that traders are treading lightly right now and are a bit skittish after the recent selling. They realize that the market is high but are concerned that it could go higher and they want to be in the market to participate in the continued rally.
For my part I am staying with my Put Selling and I will buy to close any positions that reach into pennies. I do not plan to hold any put positions to options expiry if there should be any sign of a change in trend. I still see little risk to the market and stocks like Microsoft Stock continue to interest me.
I sold a lot of puts on Intel lately and today the stock turned back up. I believe Intel is under-valued here. My market timing indicators then are saying that the market direction remains up and risk to the downside is limited so put selling continues to be rewarding with little risk of assignment on out of the money puts that I continue to sell on my favorite stocks.
