Market Timing sometimes is pretty simple as happens for Feb 9 2012. All the market timing indicators I use are screaming that the stock markets are extremely overbought and market direction is now changeable. In other words, market direction is stalled and should move lower. All it will take is some semblance of trouble and the market will rest and pull back to consolidate and test support.
The rise in the NASDAQ to highs not seen since 2000 are a clear indication that the stock market has temporarily put in a top. The stock market needs to rest and consolidate. So many analysts in the past few days have come on board the “bull wagon”, that obviously they can’t all be right. Even Bill Gross who seems to hate equities has become an equity bull. This is often bad news for those who enjoy equities.
The rise from the November 2011 lows has been strong, dramatic and basically without a break. This is so typical of a bull market that I am surprised veterans like Bill Gross would get sucked into thinking everything is all right. Markets both bull and bear always overshoot on market direction. This is part of the reason I stay with put selling as my main investment method. It is also why since January 2011 I have used the cautious bull strategy for investing.
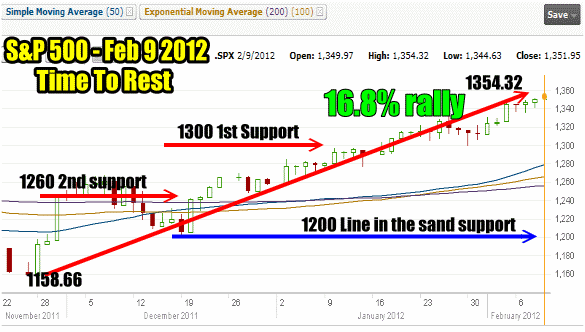
Below is the S&P 500 stock chart since the November bottom. After a 16.7% spectacular rally with no stalling out, the S&P500, like all the US Stock Markets are in extremely overbought territory.
It is important for investors to understand that once every analyst has jumped on board and made every one of them a bull, you know that a top is in for a while.
There are three levels of support. The first level is at 1300. The second level of support in the S&P 500 is at 1260 and the final “line in the sand” support is back at 1200. That is the line that makes or breaks this bull market and I have referred to it often. If 1200 on the S&P500 breaks, then the bear was just having a short snooze.

Market Timing Is Often Easier Than Investors Think. After a 16.8% rally the market is definitely ready to rest as the S&P 500 has become extremely over bought.
Market Timing / Market Direction Indicators
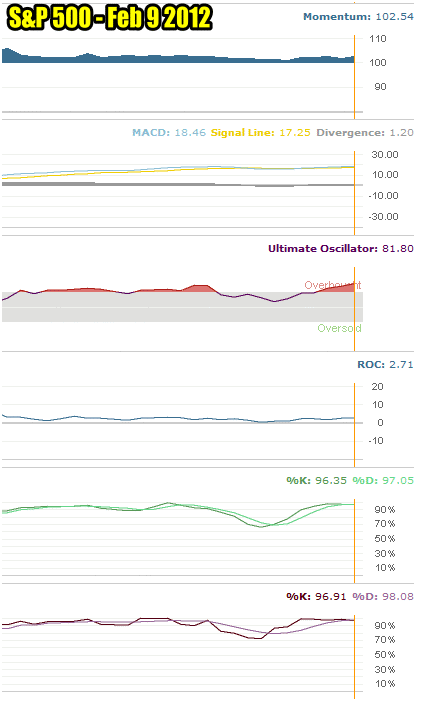
Below are my market timing indicators for Feb 9 2012. Interestingly momentum remains reasonable at 102.54 as as a market timing indicator it is well worth watching. Should it fall below 100, then it will be a matter of making sure it stays within a range not below 90. Should it fall below 90 then selling should intensify pushing the volatility higher and making put selling even more profitable with larger premiums.
The market timing indicator MACD at 1.2 is positive but has seen the signal line (yellow) stay close to MACD which indicates that the recent highs in the S&P 500 will have trouble holding. The Divergence needs to be higher to show that new money is coming into the market to support these price levels.
The Ultimate Oscillator which has long been my favorite market timing indicator has flashed over bought a number of times over the past two weeks and it warning with a reading at 81.80 that market direction is about to change or at least stall here. Select this market timing link to learn more about the Ultimate Oscillator.
I use more than just one or two of these market timing indicators because no single indicator is the best at predicting market direction. For example if I was using just the market timing rate of change indicator (4th one from the top) I might believe there is still no problem with the market as it is remaining positive.
Aside from the Ultimate Oscillator, the slow stochastic and fast stochastic are flashing huge market timing warnings that the market direction is going to change. Both are in the high 90’s but the fast stochastic (bottom market timing indicator in the chart) is at a staggering 98.08.
Whenever the fast stochastic has been at such a high reading, the stock markets have sold off. I believe so strongly in such a high reading confirming market direction down, that I bought 20 SPY PUT contracts today. I purchased the SPY PUT Apr 21 2012 $135 today for $4.35.

Market Timing technical indicators show that the market is extremely overbought. Market Direction is definitely down.
Market Timing Indicators Confirm Market Direction is Changing
With the three market timing indicators, Ultimate Oscillator, Slow Stochastic and Fast Stochastic flashing such huge warnings there is no way that I would not be buying SPY PUT contracts today.
The rally from the November low is about to end. It has been a spectacular rally but this market needs time to rest, consolidate and decide the next market direction move. Hopefully after a short rest the market direction will change back to up. But I cannot guess the market direction more than what my market timing indicators are telling me right now and the three most important indicators for this rally are telling me that it is time to purchase some SPY PUT contracts for a move lower. Remember that throughout this rally from the November lows, the market timing indicators confirmed the market direction uptrend. They flashed a couple of times that there was market weakness but overall the trend was intact. The market timing indicators are now telling investors that the market direction will change and the market must test some of the recent highs to see what support is available before either resuming the market direction uptrend or moving lower into strong support zones.
