Market timing tools are plentiful. There are market timing tools for just about every aspect an investor can imagine. When I open my charting tools with my discount broker there are more market timing tools than I could even use. The key to understanding market direction or stock direction is knowing which market timing tools have worked consistently in the past. For this very reason I use every day the same market timing indicators. These are MACD, Momentum, Rate Of Change, Ultimate Oscillator, Slow and Fast Stochastic and finally the moving averages. The other indicators worth using intermittently are Bollinger Bands as per my article on early warning tools to spot a collapsing stock and volume which can greatly assist in predicting market direction.
But once in a while one or two market timing indicators end up being the priority tools to use to understand market direction. Today that tool has to be the 50 day moving average. Select this market timing link to learn more about the moving averages. Let’s take a look and see why.
Market Timing / Market Direction The 50 Day Moving Average
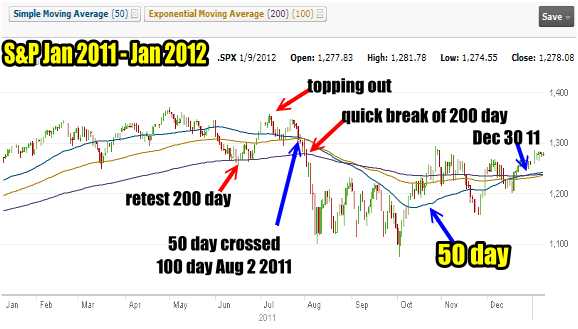
Below is the S&P500 chart for the period from Jan 2011 to Jan 2012. The blue bar, which I have marked is the 50 day moving average. When the market got into trouble in June, it retested the 200 day moving average and then quickly bounced higher. It was a typical topping out of the market and it easily broke through the 200 day in August.
The 50 day crossed the 100 day moving average on August 2 2011. On December 30 2011 the 50 day finally managed to cross back over both the 200 day and 100 day moving averages. This was the first time since August that the 50 day has regained momentum.

Market Timing / Market Direction Chart For S&P 500 Jan 2011 to Jan 2012 plotting the 50 Day
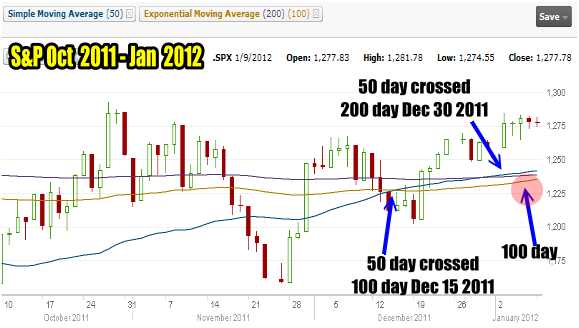
Let’s take a closer look in the 3 month chart below. The 50 day crossed the 100 day on December 15 and the 200 day moving average on Dec 30. These are positive signs as the 50 day has not regained momentum since it fell through the 100 day back on August 2 2011.
However it is important to also realize that the 100 day has not crossed over the 200 day which for many investors is key to the market direction being confirmed as back up.

Market Timing / Market Direction S&P 500 Oct 2011 to Jan 2012 showing the crossovers of the 50 day moving average
The 50 day moving average then is a key market timing indicator which gives a decent mid-term outlook for market direction. While it is true that the 100 day still needs to cross the 200 day to confirm the market direction as up, the 50 day has been the true market timing mid-term predictor and since it fell in August, it has been an accurate market direction indicator throughout 2011. The 50 day has been on a rising trend since Mid-October without exception, including the downturn in November.
Therefore I believe the 50 day market timing indicator holds the key to the next stage of the market direction going into 2012. If the 50 day holds above both the 200 and 100 moving averages, then it is only a matter of time before the 100 day will cross the 200 day and confirm market direction as up.
My Market Timing Indicators
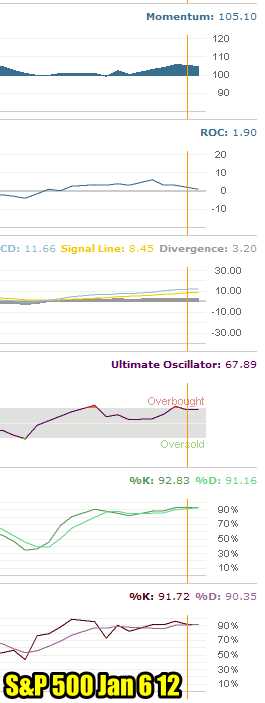
For a shorter term outlook here are my usual market timing indicators. None of them would indicate that the market direction for the short-term is higher. In fact, all of my market timing indicators point to the S&P 500 market direction as turning down. This could however be due to an overbought condition which the Ultimate Oscillator and both Stochastics indicates is present.

Market Timing / Market Direction Technical Indicators for Jan 6 2012
Market Timing / Market Direction Candlestick For Jan 6 2012
For those who like to follow the candlestick for Friday Jan 6, it was a black spinning top which means that the market opened lower and closed lower with indecision between bulls and bears. This is a confirmation that the market direction for the short-term has changed to down.
Market Timing / Market Direction Summary
Alcoa kicks off the earnings season on Monday after the market closes with its results. They are expected to be poor and may report anywhere from a .03 cent loss to a .02 cent gain. This pales in comparison to the .21 cents it earned for the fourth quarter last year. Once these numbers are released it will be interesting to watch the 50 day moving average for any sign that it cannot maintain momentum. If the 50 day turns back down then January could have already posted its gains for the year. While all my shorter term market timing indicators are turning down, none are negative and often they are simply indicating an overbought condition which can be seen in the ultimate oscillator and both stochastic readings. The market could bump along until the overbought condition is digested and the market direction can continue up. As a market timing indicator, the 50 day bears close watching at this time.
