MARKET TIMING indicators today are at the tipping point. I have seen these readings before and either the market must rally or there will be a tumble ahead. My market timing indicators have never failed when giving this type of reading. The sentiment of investors is now so soured that either they will step up from here and start to dump stocks or they will turn the market direction around as they have done before and try to bounce back.
Let’s look at the market timing indicators first and from there we can make an informed decision on market direction.
Market Timing
Indicators For May 16 2012
Yesterday’s market timing column was anything but happy. Today the results reflect the continuing fear among investors as market direction slides ever lower. Europe dominates and everything else is being tossed out.
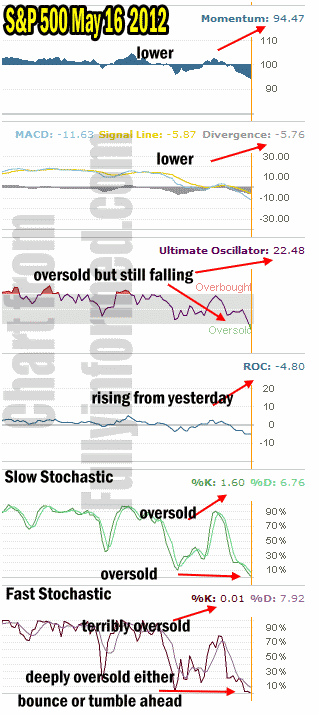
Market timing momentum indicator is lower than yesterday reflecting the continued selling. The rally in the morning was wiped out by the afternoon which is typical of a severe correction. MACD histogram is falling lower which continues to give market timing signals that the overall trend is down.
The Ultimate Oscillator is oversold but still falling and there is room for it to fall further.
The rate of change though is higher than yesterday. It is still negative but does reflect that there was some interest in buying during the day.
The most important market timing tools for today are the slow stochastic and fast stochastic. Both show the S&P 500 has reached extreme oversold conditions. The fast stochastic is reading 0.01 which is almost as low as the reading can get. In the past this reading has been the tipping point. Either the market bounces or it takes a strong tumble.

Market Timing Indicators for May 16 2012 warn the market is at a tipping point. It must rally or it will tumble from here.
Market Timing Chart For Past 12 Months
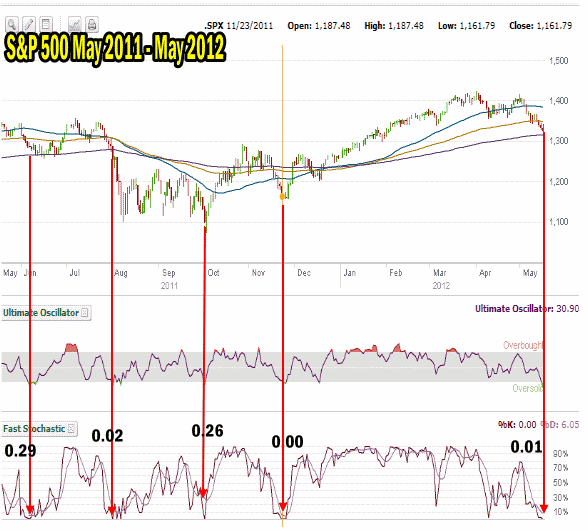
The market timing chart below for the period from May 2011 to May 2012 below show the extreme readings from the fast stochastic market timing tool and the subsequent results. In the cases where the stock market was already in a large decline the market bounced higher. However in the case where the market was selling from a top, the market tumbled and quickly. In early August last year the market fell apart after putting in a double top in July.
With the S&P 500 now breaking through 1325 the 200 day moving average is ready to break. Should this happen, the fast stochastic is indicating a major tumble lies ahead. In my market timing column yesterday I mentioned how if the 200 day moving average broke investors will begin to dump stocks. They are already nervous and all they need is a catalyst to push them into panic mode.

Market Timing Chart 2011 to 2012 shows the various extreme Fast Stochastic readings and subsequent events
Market Timing Shows A Better Chance Of A Fall Than A Bounce
Market timing indicators and the market timing chart from the past 12 months, I believe are indicating there is a better chance of a fall from here than a rally back up. There could be a bounce but unless there is enough volume, the market is set to tumble and if sellers panic they could push the stock market back to the 1200 level wiping out the Spring rally gains. If this happens, as a market timing signal, it would be a very bad sign indeed.
