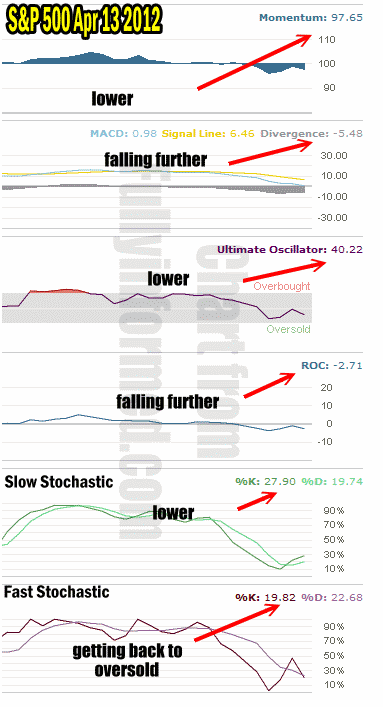
Market Timing indicators continue to erode which is a sure sign that the market direction is moving lower. The recent bounce up was exciting but as explained in the last few market timing columns, all the market timing indicators just didn’t support the rally and indeed those that are more momentum driven like the ultimate oscillator, refused to show that sentiment had changed for the positive among investors.
For the moment then it would appear that a top is in place. On Friday about an hour into the close I bought SPY PUTS to hold over the weekend. We will have to see how that hedge works out. The earnings news out of Alcoa is not enough to propel the market direction further. It isn’t necessarily that the bull market is over and that this was just a bounce from the November 25 2011 lows. It could easily be that the market direction change is simply because the rally is way ahead of itself. I indicated in many market timing columns that stocks are over-valued. Despite what every talking head or blogger is saying about stocks being cheap, honestly, they were cheaper on November 25 and even in December. They were really cheap in March 2009 and in May 2010. Don’t you find it interesting that only a small handful of these same analysts felt stocks were cheap back then?
Market Timing Indicators Show Market Direction Down
I don’t have to include an S&P 500 chart for the end of the past week. I think all investors know it ended poorly. Volume was slight and only the traders seemed to be doing much of anything. Without conviction there is no buying. Without buying stocks will fall further than normal so be prepared for possible opportunities in the days or even weeks ahead. One thing to remember is that the Trader’s Almanac pointed out that statistically during election years, April is actually a weak month and it is late May and into the summer months that the market does better. Let’s hope that is the case. If so then a possible resumption of the rally may be a few weeks away.
But I cannot trade based on what I “think” might happen. I have to stay consistent with my market timing technical indicators and right now the market timing signals are saying market direction is lower.
Market Timing Technical Indicators Reading For April 13 2012
Momentum is moving lower. The last little rally DID NOT turn momentum positive. This is a bad sign which almost always means the market direction must move lower before it can find some support. When a rally fails the market always falls.
The MACD Histogram continues to erode. MACD is now negative -5.48 and falling further.
The Ultimate Oscillator is at 40.22. If you read my market timing system article from today you know how important I think this market timing tool is. Right now it is negative enough that the market should fall further. There is still room for it to fall before reaching oversold.
Rate of Change continues to fall as well. The last rally almost got the rate of change to turn bullish but there was not enough volume and the indicator is signalling market direction down.
Slow stochastic is lower but not into bounce territory yet. Meanwhile though the Fast Stochastic shows the sharp turn from the last bounce. It will almost always fall further than the last rebound before it bounces again, despite the fact that it is nearing oversold.

Market Timing Indicators Show Market Direction Is Lower
Market Timing Indicators Flash Market Direction Down
A few market timing columns ago I indicated that the market direction was about to change. That change is now occurring. For investors who want to ride this out, selling covered calls is certainly an option. For those who are into put selling holding off with further trades is definitely a strategy that may pay bigger dividends in a few days as volatility is bound to spike higher as the market pulls back. If there is another rally next week, it must get higher than the previous attempt otherwise it is just another bounce.
Remember though that profit opportunities are everywhere. If the market direction turns down more severely than expected, consider holding some puts or buying spy puts at least 1 month out. Consider some of the stocks that set recent 52 week highs. In any strong selling, they will fall further than expected. They might be good candidates for a handful of puts. Turn to the Ultimate Oscillator to spot when the market direction may turn back up, even if it is a bounce, so you don’t get caught holding puts that will lose their value in any recovery. Don’t forget all the ultra ETFs that have been introduced in the last few years. The Ultimate Oscillator will help there too. Remember when market timing technical indicators signal market direction down, there are numerous methods to protect and profit but just as when the market went up, nothing goes straight down so watch for bounces along the way.
