Market timing indicators just a few days ago showed the market was sliding. However the spectacular earnings from Apple Stock I believed would buy the market some up days and indeed the market direction has moved higher. Then to add to this environment along came Amazon Stock and it surprised investors with terrific earnings of its own. Both of these NASDAQ companies have created enough “buzz” to get investors excited and the stock markets have responded with market direction moving back up. This marks 4 days of the latest rally and a rise of 3.5% from the low of 1358.79 on April 23. Market timing indicators are now all positive although once again the MACD Histogram is basically telling the market “show me the money”. as it is really sitting on the fence so to speak. More about that in a moment.
My market timing indicators are actually pushing towards overbought territory and showing signs that the latest rally could be getting ready for some sideways action. This is the most telling part of the last 4 days. If the market direction remains positive and keeps climbing and market timing indicators continue to support the move higher, the market might break through resistance and continue the market direction higher. Can this happen? To find out let’s review the latest market timing indicators and try to figure out what investors should be watching for next.
Market Timing S&P 500 Chart
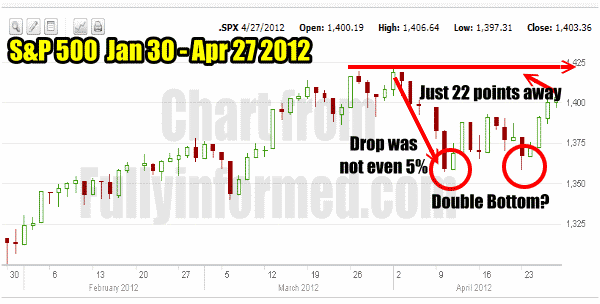
Below is the S&P500 market timing stock chart from Jan 30 to April 27 2012. The S&P 500 is just 22 points away from recovering the most recent high since the bear market collapse in early 2009. The previous pullback, despite all the doom and gloom talk was not even 5%. Looking at the chart below it may appear that the S&P put in a double bottom which could mark a resumption of the rally. No market goes straight up and the rally from November 25 2011 has produced a gain of over 20% with very little pullback. This recent pullback was the first in a long while.
As with any pullback that lasts longer than a few days, stock market analysts immediately turn bearish. It’s a problem for many investors as they become more concerned with each day that the market does not climb. However decades ago a market could rally for weeks and then trend sideways for up to a month before analysts started to worry. Today, a pullback of any more than a few days brings great concern from the talking heads on TV and throughout the hundreds of web blogs and sites. Everyone today wants action and clear indicators and markets often just don’t work that way.
This is why put selling is such a perfect strategy for today’s stock market. Dips and pullbacks can turn highly profitable through selling puts on stocks while the market gurus spread fear. Fear pushes up volatility which increases option premiums, both puts and calls. These option premiums are what I sell for my profit and income. For whatever reason, investors forget that 5% corrections in bull markets are common place. But every time a correction gets underway fear begins to climb.
Below is the VIX Index for the past few months. In March the VIX Index fell below 15 and the market sentiment turned overly bullish. I have marked on the VIX Index Chart below the period from April 2 when fear started to rise in the market as reflected by the VIX Index. However look at how despite all the doom and gloom, the VIX did not reach levels seen in mid February. Yet the way the media ranted about this latest pullback, investors must have though the market was down 20% or more.
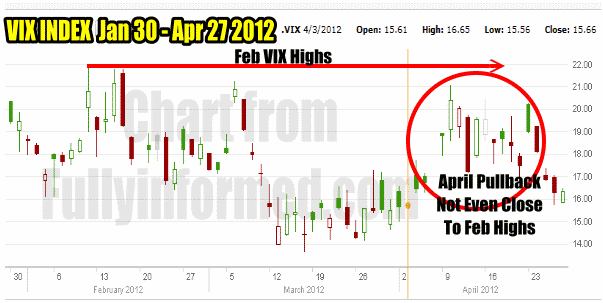
The VIX Chart for Jan 30 - April 27 2012
Below you can see the blog sentiment as registered by tickersense. The beginning of the month saw overwhelming bullish sentiment, however the second blog sentiment reading shows how much that has changed.
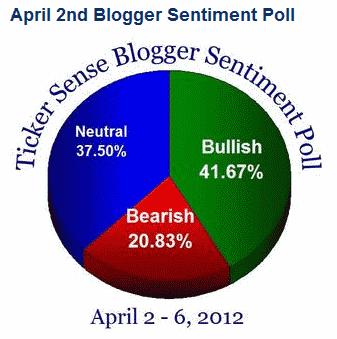
Market blogger sentiment from tickersense website for April 2 2012 shows the degree of bullishness.
Below is the same blogger sentiment two weeks later. The bearish sentiment is enormous. When markets are climbing everyone is a bull and when they don’t climb the bears start to show up. But bull markets do not climb straight up. It is the same old story of the investors who buy high and sell low. Everyone knows they shouldn’t do it, yet they continue to invest this way.
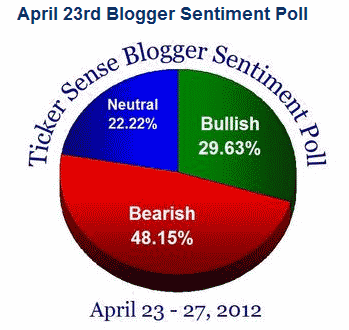
Market blogger sentiment for April 23 2012 from tickersense shows a huge increase in bearishness.
However anyone who took time to read further would have seen that money flow has increased throughout this rally and the latest downturn has seen that money flow continue. So while the talking heads have been bears the money flow says bull.
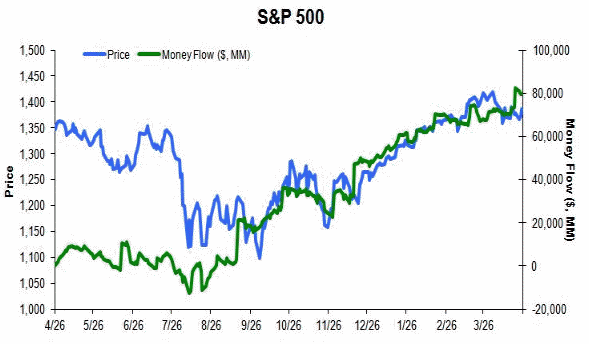
S&P 500 money flow chart from tickersense shows the continuing influx of money into stocks.
Market Timing Technical Indicators For April 27 2012
With Friday’s run-up in stocks here is what my market timing indicators are advising investors.
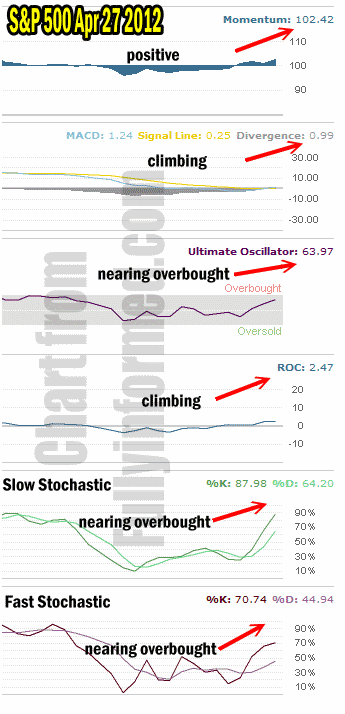
Market timing technical indicators show market direction is changing to up
Momentum market timing indicator is rising which should be expected as it is reflecting the rising valuations in the market. The Ultimate Oscillator is also rising, with a reading of 63.97. Once this market timing tool rises above 70, the market could be entering overbought but remember that the market can stay overbought for extended periods during bull markets.
Rate of change is up just slightly over Thursday as are the other two market timing indicators, Slow and Fast Stochastic. Again though this is to be expected as all three market timing indicators are simply advising investors that the push higher on Friday did not have the same volumes and conviction among investors as Thursday’s big run-up did. Both slow and fast stochastic are also nearing overbought readings but with the past two trading sessions this is to be expected.
MACD Histogram Market Timing Indicator
This then brings us to the MACD Histogram which I have left until the end. The MACD Histogram has recovered from its negative readings of previous trading sessions, and is now positive. As market timing technical indicators go, MACD (Moving Average Convergence / Divergence) is an excellent tool that looks out beyond just a day or two. With its reading on Friday finally turning positive, the length of time it took to become positive could be advising that the market is going to face stiff resistance as it tries to push higher. If this is indeed the case, MACD might be warning us that the S&P is not quite “out of the woods” so to speak. Indeed as I explained in previous market timing columns, the S&P 500 must break through the previous high and close above it AND then push higher to confirm that the market direction is still up.
What To Watch For
To conclude my somewhat lengthy review of the market direction indicators, investors should be watching for confirmation of an end to the recent pullback through the S&P 500 breaking into a new high and climbing away from it. At this stage of the rally, if the S&P 500 should pull back and be unable to break through resistance in the next few sessions, then it should mean that the stock market must pullback further than simply 5% to build enough strength to move into new ground.
My Prediction
You probably won’t like my prediction at this point because I am on the fence on this one. The rally has been nice over the past 4 days but I would have preferred to have seen a deeper correction than what the market has just gone through. With the continual inflow of money to stocks though it has been difficult for the market to fall very far.
Throughout the correction I have used the Ultimate Oscillator and Fast Stochastic market timing tools to assist in put selling as well as buying some stock for bounces. I have bought to close my put contracts early when there was a good profit and I have made a few good trades on the SPY PUT hedge as well as some stocks.
Since I have continued to sell puts and purchase and sell stocks I obviously don’t think we have put in a market top at this stage of the rally. My instincts indicate we will probably see more sideways action and another push trying to break through resistance. Overall though this has been a great pullback for put selling opportunities. As long as the market wanders back and forth as it tries to break through resistance, it will continue to profit my put selling strategies by rotating dips among my favorite large cap stocks at various times. Throughout this pullback my market timing indicators have assisted in keeping me on the right side of market direction and allowed me to profit from this small pullback.
