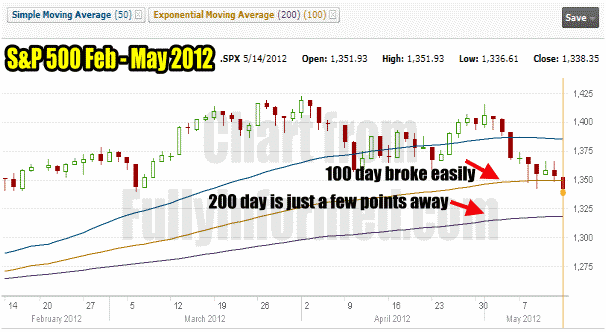
Market direction today took a turn for the worse as from the open the S&P drop quickly through 1350 and failed all day to recover that important level. In my market timing column from May 8 I indicated that all indicators were pointing that the 1350 level could not be held. Indeed todays selling pushed investors to move their bids lower and the 1350 level which the market had been continually testing last week, broke easily when buyers retreated.
After all why would buyers remain at that level with the market constantly re-testing it for support. It was obvious to me that the 1350 level could not hold, so I am sure it was obvious to more astute investors that it was time to lower their bids.
Market Direction for May 14 2012
The market direction chart for today is not pleasant. The stock market has fallen beyond the 50 day moving average and today it easily fell through the 100 day moving average. It is now just a few points away from the 200 day and a solid correction. With the market direction continuing lower, the S&P is now down more than 5% from its early April high and the sell signal given by MACD back in early April is certainly holding credibility.

The Market Direction chart for May 14 2012 shows that the market is preparing to push to the 200 day moving average.
Market Timing Indicators For May 14 2012 Show Market Direction Still Down
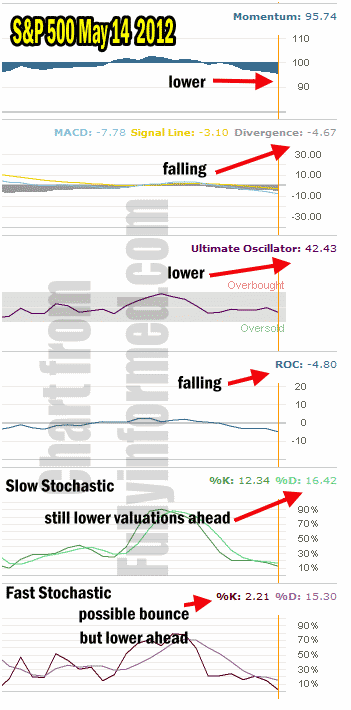
My market timing indicators for today are showing the market direction as still lower.
Momentum market timing indicator is showing the downward movement is gaining steam. MACD (Moving Average Convergence / Divergence) which is among the best momentum and market timing signals is continuing negative and with a reading of negative 4.67 shows that the market has more room to fall.
The Ultimate Oscillator which was trying to at least remain flat has this evening turned lower. Rate of change is falling as well and now down to negative 4.80.
The slow stochastic market timing indicator continues to flash market direction lower. Today’s reading is %K 12.34 and %D 16.42. With %D that higher than %K this is telling us that the market direction is still under pressure to move lower.
The fast stochastic is the only indicator that with a %K reading of just 2.21 is signalling that the market might bounce from its oversold state. Meanwhile though the %D indicator is high above %K with a reading of 15.30 which signals that any bounce is just a bounce as the market is still going to move lower.

Market Timing Indicators For May 14 2012 Show Market Direction still lower
Market Direction / Market Timing Summary
With investors now worried about the market direction change, they are beginning to pull back from present prices which will only lower prices further. The VIX Index is now above 20 and even if the market bounces and the VIX returns to below 20, all the indicators are warning that any bounce is only a bounce and the market direction will move lower before it finds a base.
