Market Direction today was all downhill. Whether it was worry about the Fed not moving into QE3 or simply a reason to sell to lock in some profits now that the stock market had made a new high. Whatever the case it was downhill for the day. Unlike previous days there were no dip buyers today to push market direction back up. Obviously they believe there is more selling in the upcoming days which will afford better prices as the market direction moves lower.
There has been a lot of talk that this rally to new highs was sparked by the belief among investors that the Fed would act and provide more liquidity which in turn would push up stocks and push down the US Dollar. But the signals from the Fed are mixed although that could simply be wishful thinking on the part of investors.
Market Direction Chart For Aug 23 2012
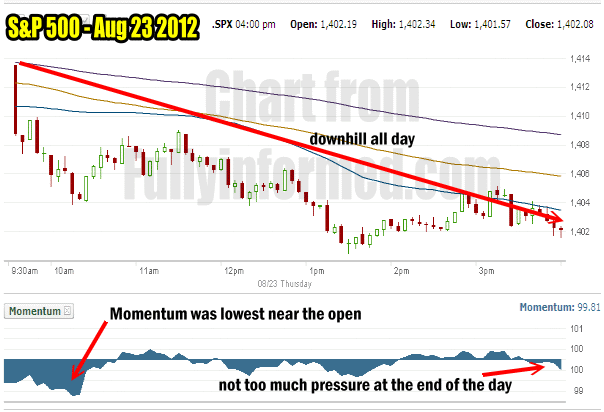
The market direction rally higher in stocks has been a pattern of investors stepping in on every dip and buying that dip to push stocks back up. This morning the S&P 500 sold off out of the gate and continued to sell until the low for the day was put in around 1:30. The market direction rally back was anemic to say the least and ended with the stock market closing nearing the lows for the day. Momentum to the downside was greatest in the morning and then pressure eased throughout the rest of the day. While the market direction fell to a new low around 1:30 PM the downward momentum was nothing like the morning. This brought in a few buyers and into the close there was little momentum to the downside.

The S&P 500 market direction for the entire day was downhill. What happened to the dip buyers today?
So was the market direction fall overdone today? It would appear looking at momentum that the market direction could swing up at the open tomorrow but market timing technical indicators point to more selling tomorrow. So a bounce in the morning could be followed by more selling to close out the week as many investors will not want to hold positions over the weekend. Let’s look at the technical indicators at the close of the day.
Market Timing Technical Indicators
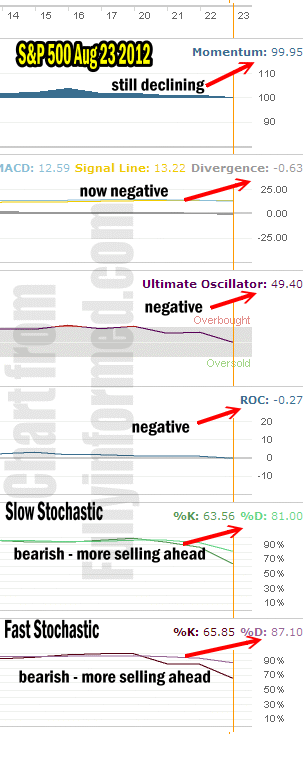
While at first glance today’s damage might not appear too bad, all market technical indicators turned negative by the close.
Momentum is negative, MACD has turned negative, Ultimate Oscillator has turned negative and rate of change is negative.
Slow and Fast Stochastic are bearish with both indicating there is still more room for the market to fall before it reaches oversold.

Market timing technical indicators are all negative indicating market direction is lower.
With all the market timing indicators negative and short-term market direction obviously heading lower the question is are the analysts right that the market is putting in a second top here?
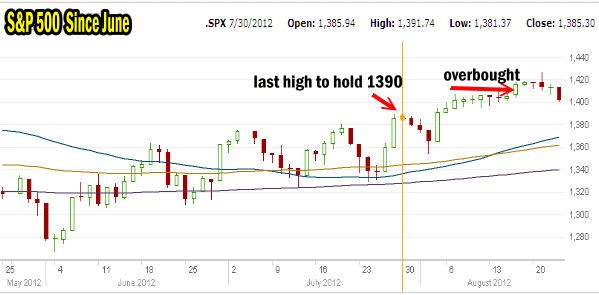
Looking at the market direction since June the pattern of higher highs and higher lows is obvious. The prior high is about 1390 and that is the level to watch for this pullback. I think part of the problem with this last rally was too much investor enthusiasm. The market direction up in the last rally was too overbought for too long as investors kept pushing the market direction to extremes. Extremes are common in the stock market and they always bounce back, whether the extreme is up or down.

Market Direction Since June 2012
Market Direction Summary For Aug 23 2012
I did a number of trades today including more Intel Stock, some Coca Cola Stock naked puts and YUM Stock naked puts. The thing I like most about naked puts is the ability to continue to earn a profit even if I am wrong. If this is a second top and I don’t pretend to know one way or the other, then I am selling puts at strikes I like on stocks I like. This is always my goal. If however this is just a retest of the most recent high and a result of an extremely overbought market that needs to consolidate, then my Put Selling will also work out in my favor.
Put Selling at times demands a certain sense of calm when selling during periods of weakness in the stock markets. Yet that is what drives up put premiums. Whenever the VIX has fallen below 14 over the last 4 years, the market has responded by entering a period of calm for only a few days before the volatility returns. It is this volatility that keeps put premiums profitable, but it also requires those who are Put Selling to take a chance and sell during sell-offs. By staying with small contract sizes and adding lower strikes as a stock pulls back, I can add to my profit and have additional protection in case the stock should slip further than anticipated.That remains the strategy while I wait to see if the market direction can turn back up next week, but for now market direction looks to be ready to continue lower.
