Market Direction has been steadily climbing, but since setting a low not seen since early 2007, the VIX Index has been steadily climbing. As mentioned in a number of articles studying market direction and profiting by being able to judge when the market direction could change from up to down, the VIX Index should be in all investors toolbox.
Market Direction and Understanding The VIX Index
There are many people who believe that everything on the stock market is manipulated and that the VIX Index is just another such manipulated asset. Considering all the manipulation we have learned about recently with Libor-rigging there is probably a lot of truth to manipulation theories.
But leaving manipulation aside, no matter where you stand on that fence, market direction can be determined by watching the VIX Index. This is because the VIX Index is built upon the buying and selling of options for protection as a key component.
Market Direction and Risk On and Risk Off
When market direction rises, investors reduce or stop buying puts to protect their trades. This is because they believe the market direction move higher has some staying power and buying protection through puts is expensive. Why buy protection when stocks are climbing.
This has been the case as the market direction has risen throughout January. The VIX Index declines as less protection is being purchased which indicates that investors are less worried about the possibility of a collapse in stock valuations. This is known as RISK OFF. The term’s definition is obvious. Investors are less worried and they take off any protection and let their positions run. Insurance is removed and investors believe there is very little risk of a correction. Risk is off.
The opposite is true as the VIX Index climbs. The more the VIX Index climbs, the more protection is being bought. This is RISK ON. Again the term’s definition is obvious. Investors become worried about a possible pullback or correction in stocks. Investors return to buying protection against loss and as more investors buy protection rather than sell out of positions they push up the VIX Index which measures volatility by studying the buying and selling of options. This buying of puts indicates that there is growing concern of a correction so Risk of loss is back ON. Insurance is basically BACK ON or RISK ON returns to the market.
Market direction does not have to move lower during this risk on period. In fact often it does not move lower. But the magnitude of the move higher often worries investors and as the market direction climbs they begin to buy puts to try to protect their gains, rather than sell out of their positions.
The VIX Index Can Signal Market Direction Changes
Market Direction changes can be signaled by the VIX Index. As more and more options are bought for protection the VIX Index rises and usually the increase in protection can signal a change in market direction. Market direction may not fall, but it may not rise further either. The VIX Index can signal everything from market direction up to market direction sideways to market direction down.
VIX Index Daily Chart For January 2013
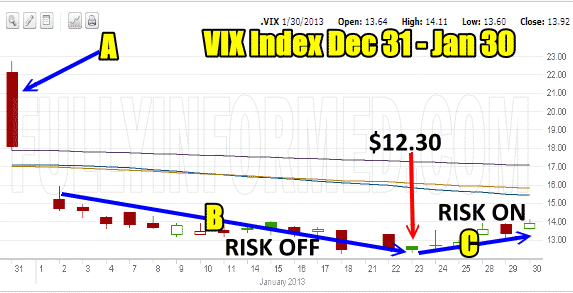
To understand this market direction timing tool and the risk on and risk off trade, let’s review the daily chart for January 2013 below.
A. December 31 saw a huge drop in the VIX Index from above $22 down to $18. This was a huge drop all caused by market direction moving higher.
B. The VIX Index continued to decline as market direction continued to climb. by January 10 the Risk Off trade was noticeable as few investors were buying protection and the VIX Index fell below $14, $13 and then $12. By Jan 23 it hit a low of $12.30.
C. Since then the Risk On trade is gathering strength and the VIX Index has risen. From a low of $12.30, today (Jan 30) the VIX Index hit an intraday high of $14.11. This marks a 14.7% increase since Jan 23. Buying call options 2 months out on January 23 would have been a very nice trade.

VIX Index for January 2013
S&P 500 Daily Chart Comparison for Market Direction
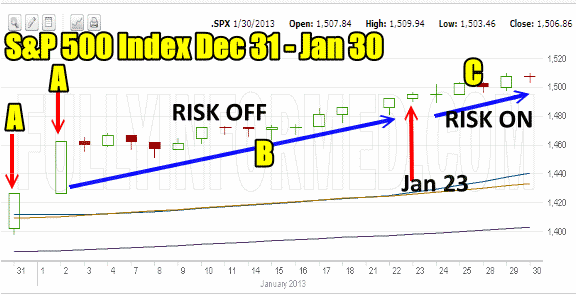
Let’s compare market direction during the same period through the S&P 500 daily chart below. I have used the same keys to mark on this chart to compare to the above VIX Index chart.
A. Two big market direction pushes higher on December 31 and January 2 commenced the drop in the VIX Index.
B. As the market direction climbed higher fewer investors were buying puts and the Risk Off trade developed. January 23 is marked on the chart below which corresponds to the VIX Index hitting $12.30.
C. Since then the number of investors back buying protection is reflected in the VIX Index climbing to above $14. This is only natural when you look at the chart. The VIX Index is up 14%. During the period however from Jan 23 to Jan 30 the S&P market direction while higher, is actually up just 1.3% from the market direction intraday low of $1489.90 on Jan 23 to today’s intraday high of $1509.94. This is just 20.04 points since January 23.

S&P 500 January 2013
Market Direction and VIX Index Summary – The Outlook
Market direction since January 23 is showing weakness, tiredness and a growing topping action. The candlesticks charting analysis from the FullyInformed Members section has for the past couple of days warned that the market direction is about to change. Now the VIX Index Risk On trade is also warning that the market direction will change. As well my daily market direction technical analysis indicators have been concerned for several days now that the market direction up is “running on empty” and pressure to the downside is building.
Market Direction technical analysis while considered as “bogus” by many investors actually is not that difficult. By combining a variety of technical indicators and taking a moment to reflect on them any investor can learn when to be cautious and when to have capital committed.
For those of us who love Put Selling, having knowledge of possible market direction changes assists in knowing everything from when to commit more capital to Put Selling trades through to when to buy to close early, when to increase contract sizes and even how far out in time to be Put Selling, whether weekly, monthly or further.
Judging Market direction remains the key to big profits and protecting those profits. Taking a few seconds each day to read the VIX Index is time well spent. The VIX Index offers market direction clues every day for investors.
Even if wrong on your judgement and you choose to be cautious when the market direction continues higher, it is not a mistake. Exercising caution when investing in risky assets is rarely the wrong move because it is just as important to protect hard-earned gains and capital as it is to continue to compound the portfolio through more trades. Being cautious when market direction claws its way higher in the face of conflicting economic news is rarely a poor choice and often the VIX Index can be consulted to confirm or deny your stance.
Internal Market Direction Links
Profiting From Understanding Market Direction (Articles Index)
Understanding Short-Term Signals
Market Direction Candlestick Daily View (Members only)
Market Direction Portfolio Ongoing Trades (Members only)
