FullyInformed.com
Generic filters
Exact matches only
Search in title
Search in content
Search in excerpt

Market Direction View From The Russell 2000 ETF

Feb 18, 2013 | Stock Market Outlook

In my intraday market direction comments on Friday Feb 15 2013 I commented how the Russell 2000 might be worth following while the S&P 500 is stuck in a sideways market direction. Often when the major indexes are having a tough time giving clear signals I turn to the Russell 2000 as it represents a good cross section of small cap stocks and the signals it gives can be compared to the S&P 500 for a possible confirmation of market direction.

Market Direction Russell 2000 for Friday Feb 15 2013

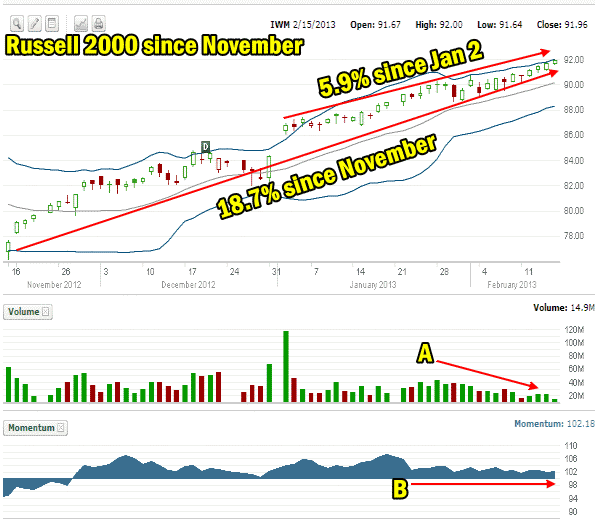
The Russell 2000 ETF has the trading symbol of IWM. On Friday it closed up just 0.03 at $91.74. As explained on Friday in the intraday market direction comments, IWM has had a terrific return so far this year. It is up 5.9% as on January 2 and up a stellar 18.7% since the markets bottomed on November 16 2012. I explained in my intraday market direction comments that in the Russell 2000 daily chart below you can see that volume is declining, never a good sign that the ongoing rally will continue (marked as A) but momentum (marked as B) is steady which is a good sign of strength.
Market Direction and Russell 2000 ETF

Market Direction and Russell 2000 ETF since November 2012

Market Direction Technical Indicators Russell 2000

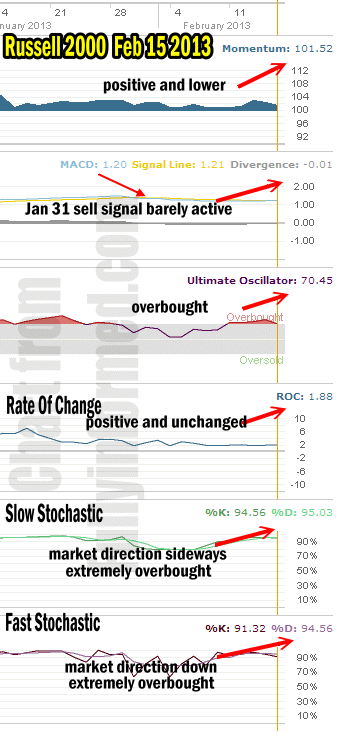
Let’s use the same market direction technical indicators that I use for the S&P 500 and apply them to the Russell 2000 as of Friday Feb 15 2013 and see if we can get a clearer picture of market direction.
Market Direction Technical Indicators Russell 2000

Market Direction Technical Indicators Russell 2000 ETF

For Momentum I am using the 10 period. Momentum is positive and like the S&P 500, it is falling. It is though far more positive than the S&P 500 momentum.

For MACD Histogram I am using the Fast Points set at 13, Slow Points at 26 and Smoothing at 9. MACD (Moving Averages Convergence / Divergence) issued a sell signal on the Russell 2000 ETF on Jan 31 when the ETF was at $89.58. Unlike the S&P 500 the Russell 2000 sell signal was weak and has remained weak ever since. On Friday the sell signal although active was only negative 01 which is more flat than negative. Since the sell signal was issued, the Russell 2000 ETF is up 2.41%.

The Ultimate Oscillator settings are Period 1 is 5, Period 2 is 10, Period 3 is 15, Factor 1 is 4, Factor 2 is 2 and Factor 3 is 1. These are not the default settings but are the settings I use with the S&P 500 chart set for 1 to 3 months.

The Ultimate Oscillator is extremely overbought.

Rate Of Change is set for a 21 period. Rate Of Change is still positive and has been almost unchanged for 7 trading days.

For the Slow Stochastic I use the K period of 14 and D period of 3. The Slow Stochastic is overbought to the extreme and with both K% and D% readings so close, it is truly more sideways than down or up.

For the Fast Stochastic I use the K period of 20 and D period of 5. These are not default settings but settings I set for the 1 to 3 month S&P 500 chart when it is set for daily. The Fast Stochastic is also extremely overbought but it is signaling a definite downtrend in the market direction of the Russell 2000.

Market Direction Outlook For Feb 19 2013 for the Russell 2000

The market direction outlook for the Russell 2000 is almost the same as the S&P 500. There is underlying strength just like the S&P 500 and the signals being generated are also primarily cautionary in tone. This is typical of a bull market in a rally mode as it nears the end of a rally or when it is consolidating. The question posed by the two market direction outlooks is whether this is a consolidation or the last gasp of the rally. The MACD sell signal was very weak on the Russell 2000 since Jan 31 but because the move higher since then was a grind not a rapid move, the market direction technical indicators are having the same problem as they did with the S&P 500.

Even with the Russell 2000 then, the market direction indicators are advising investors that caution is advised at this stage of the rally. That does not mean don’t stay invested but it means to stay careful. When Put Selling, stay out of the money and sell smaller contract sizes. When buying stock, take smaller positions and be prepared to sell to close positions for even slim profits at the first sign of weakness. Don’t hold positions too long and consider taking profits all the time. Remember that when you take a profit, even if you are wrong and the move turns back higher, you have captured a profit and released your capital for further investments. There is never anything wrong with taking profits in an overbought market.

Internal Market Direction Links

Profiting From Understanding Market Direction (Articles Index)

Market Timing Articles Index

How I Use Market Timing

Understanding Short-Term Signals

Various Market Timing Systems

Market Direction Candlestick Daily View (Members only)

Market Direction Portfolio Ongoing Trades (Members only)

Market Direction External Links

Market Direction IWM ETF Russell 2000 Fund Info

Market Direction SPY ETF 500 Fund Info

Recent Outlooks

Stock Market Outlook for Fri Apr 11 2025 – Bounce Likely But Highly Suspect

Prior Trading Day Summary: Thu Apr 10 2025 found stocks selling lower again despite Wednesday’s massive rally as China’s tariffs took center stage again. Nervous investors decided to take profits from Wednesday’s rally. The S&P ended the day down 188 …

Morning Investing Strategy Notes for Thu Apr 10 2025

For FullyInformed Members the morning Investing Strategy Notes for Thu Apr 10 2025 review the massive rally on Wednesday and the outlook for stocks following the change in the tariff stance from the White House. Stocks discussed for today include …

Stock Market Outlook for Thu Apr 10 2025 – Choppy Day With Dips Likely But Higher Close

Prior Trading Day Summary: Wednesday saw a massive relief rally after news of a 90 day reprieve in tariffs and a drop to 10% for those countries that President Trump deemed “friendly” although China, Canada and Mexico were not on …

Morning Investing Strategy Notes for Wed Apr 9 2025

For FullyInformed Members the morning Investing Strategy Notes for Wed Apr 9 2025 review the trading on Tuesday. Stocks discussed for today include the SPY ETF, the VIX, TQQQ ETF, SQQQ ETF,  Constellation Brands Stock (STZ) and more. The morning …

Stock Market Outlook for Wed Apr 9 2025 – Bearish Bounce – Panic and Lower

Prior Trading Day Summary: Tuesday saw a typical bear market bounce that trapped a large number of investors. The early morning bounce seemed strong but volumes were low. When the news came regarding Chinese tariffs the market fell apart. Volumes …

Morning Investing Strategy Notes for Tue Apr 8 2025

For FullyInformed Members the morning Investing Strategy Notes for Tue Apr 8 2025 review the strong rebound on Monday and whether it has any staying power. Stocks discussed for today include the SPY ETF, the VIX, TQQQ ETF, SQQQ ETF, …

Stock Market Outlook for Tue Apr 8 2025 – Bounce Likely But Highly Suspect

Prior Trading Day Summary: Monday saw a wicked start to the day but a rumor on a delay in implementing tariffs stopped the selling despite the White House denying the rumor. In a dramatic reversal the indexes all rallied strongly …

Morning Investing Strategy Notes for Mon Apr 7 2025

For FullyInformed Members the morning Investing Strategy Notes for Mon Apr 7 2025 review the continued sell-off on Friday and the outlook for Monday with stock futures showing a large decline to start the week. Today’s Investing Strategy Notes focus …

Stock Market Outlook for Mon Apr 7 2025 – Bounce Possible At Any Time But Still Bearish and Lower For Now

Prior Trading Day Summary: One word described Friday April 4 2025 – Brutal. The S&P collapsed 322 points ending the day at 5074. For the week the S&P was down 507 points. Truly stunning developments and pushing the SPX through …

Morning Investing Strategy Notes for Fri Apr 4 2025

For FullyInformed Members the morning Investing Strategy Notes for Fri Apr 4 2025 review the collapse of stocks on Thursday and the outlook for Friday. Stocks discussed for today include the SPY ETF, the VIX.  TQQQ ETF, SQQQ ETF and …

Stock Market Outlook for Fri Apr 4 2025 – All About The March Jobs Numbers

Prior Trading Day Summary: Thursday saw stocks collapsing worldwide following higher than expected tariffs from President Trump. At was a brutal day, the worse single day since 2020. The SPX closed down 274 points to 5396 on 7.3 billion shares …

Morning Investing Strategy Notes for Thu Apr 3 2025

For FullyInformed Members the morning Investing Strategy Notes for Thu Apr 3 2025 review the outlook for stocks after tariffs were announced on Wednesday. Stocks discussed for today include Chevron Stock (CVX), Exxon Mobil Stock (XOM), VIX ETF, TQQQ ETF, …

Stock Market Outlook for Thu Apr 3 2025 – Bearish Following Higher Than Expected Tariffs

Prior Trading Day Summary: On Wed Apr 2 2025, investors rallied stocks for a third day on hope that the tariffs being introduced would be lower than many expected. As we found out after the market closed, the tariffs were …

Morning Investing Strategy Notes for Wed Apr 2 2025

For FullyInformed Members the morning Investing Strategy Notes for Wed Apr 2 2025 review the second higher day on Tuesday. Stocks discussed for today include VIX ETF, TQQQ ETF, SQQQ ETF, RH Stock (RH) and more. The morning Investing Strategy …

Subscribe For The Latest News