My market direction outlook yesterday was for the possibility of a weak bounce and then more selling. There was enough oversold sentiment to provide a bounce and Monday did see enough selling to bring some buyers into the stock market. At the close of trading today though the market direction remained unchanged despite the little rally today.
One of the more interesting events today was the S&P close which was right around the 200 day moving average. While many analysts have concluded that the 200 day moving average indicator is no longer very effective, I have found that the 200 day moving average is still quite effective and a practical market timing indicator. Today is just another example of the market clinging to support at the 200 day.
SPY PUTS Bought
Towards the end of the day around 1325 or so I bought SPY PUT Contracts. While the rally tried hard to impress, overall I was not impressed and the market timing technical indicators do not reflect any strength in today’s rally. Therefore I bought my spy puts. You can read about the trade here.
Market Direction Remains Locked Down
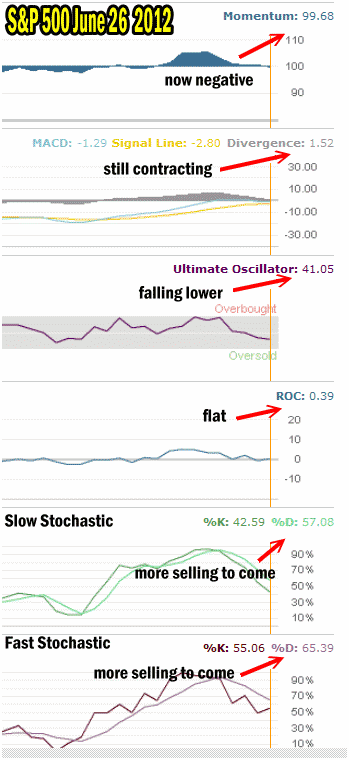
As I indicated, a bounce today should have been expected. All the market timing technical indicators did not support today’s little rally but instead confirmed market direction remains lower. Momentum fell below 100.00 despite the rally, indicating that market direction is continuing to decline.
Market Timing Indicators For June 26 2012
The market timing indicators are all continuing to reflect a down bias in the market direction. As explain, momentum is now negative. MACD (Moving Average Convergence / Divergence) has contracted even further with a reading of just 1.52. The contraction in MACD commenced on June 21 and is decidedly negative. Should Wednesday be a strong down day, MACD will definitely end up negative.
The Ultimate Oscillator fell even lower today from yesterday. Today’s reading of 41.05 is getting closer to oversold, which is a reading below 30.
Rate of change with a reading of 0.39 is essentially flat on the day.
Again it is the stochastic indicators that are the most informative.
The slow stochastic is now %K 42.59 and %D 57.08. While still negative, the divergences are closer which could mean that rather than a bigger move lower the market may drift lower.
Fast Stochastic has a similar reading with %K 55.06 and %D 65,39. But the important indication here is that the outlook is negative. Fast stochastic is signalling further deterioration over the next day or two while the slow stochastic remains negative further out in time.

Market timing indicators confirm that market direction remains down.
Market direction and market timing outlook
The chance that today’s bounce could continue into Wednesday will not be uncommon, but we may see a bounce at the open and then selling continuing to pressure the market direction. With the confirmed market direction still lower as determined by the overall consensus of the market timing indicators, it remains prudent to keep cash at hand and watch for opportunities but keep positions small to benefit down the road should stocks begin a second leg down if they break through 1275.
