Market Direction last week saw a consolidation of the market. The S&P intraday market direction high was on Dec 3 when the S&P hit 1423.73. From there the S&P pulled back a bit but stayed within a very tight range. Friday though saw the S&P close at 1418.67 the highest close since Nov 6. Market direction remains cautious but is up. There are a few signs that need to be watched. To cover off these market direction signs I want to present 3 stocks and 1 ETF that are worth watching as the market direction tries to push higher.
Market Direction – Stocks To Watch
After the stock market crash in 2008 to 2009, the NASDAQ commenced the recovery of all the indexes. Three stocks were involved in leading the stock markets to recovery. These were Priceline Stock, Apple Stock and Google Stock. These three tech giants have all been leading but since setting new highs recently all three are having trouble.
While the stock market direction may continue higher, the job of investors is to make sure they do not get caught in a topping formation. The clues are straight forward. As the stocks continue to climb, these three tech giants need to stage a recovery. Let’s look at what levels investors need to be aware of.
Google Stock
The three levels for Google Stock are $765, $759 and $705. All three of these levels need to be watched. If Google stock pushes above $705 and the market direction continues higher, then Google stock needs to push above $759.00. After that it needs to recover $765. If Google stock does not recover any of these levels, the market direction recovery will most likely fail and this rise in valuations in the overall indexes will not be sustained.
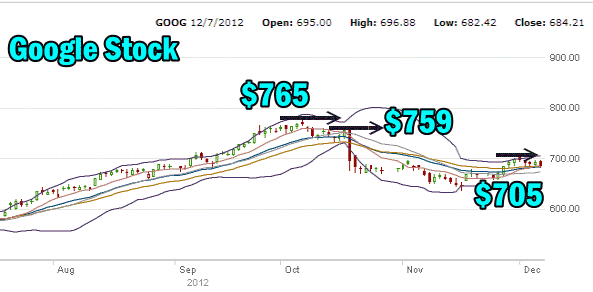
Google Stock 6 month chart
Apple Stock
Apple Stock has three levels to attempt to recover. $700, $650 and $600 all need to be recovered.
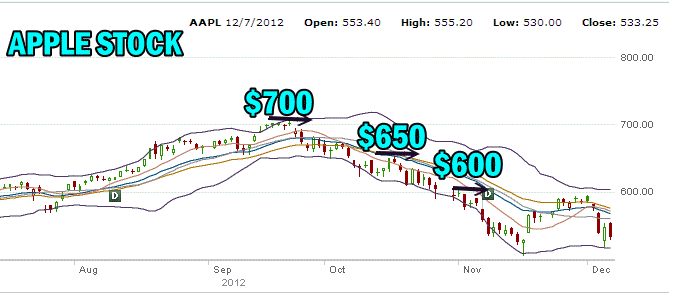
Apple Stock 6 month chart
Priceline Stock
Priceline stock is doing the best of all three stocks at holding its high valuations and recovering. There are only two levels to reach. The first at $650 was passed this week. The next level is $690.00 and Priceline Stock is within 31 points of the $690 high. .
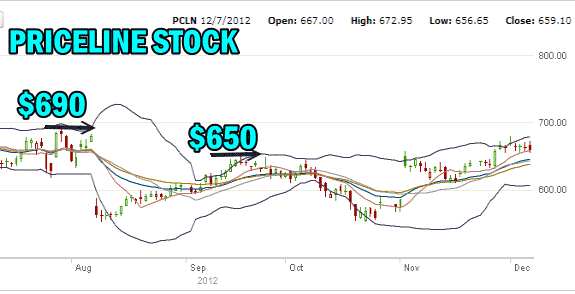
Priceline Stock Chart
All three stocks do not need to recover in order for market direction to be confirmed as still up. But one of these must recover and keep climbing. Of all three tech stocks, Priceline Stock was the first to lead the recovery in 2009. While it too pulled back, its correction was smaller than Google Stock or Apple Stock and it remains well within reach of its high. This could be the stock to continue to lead the market direction higher into December.
XLF Financial ETF
Part of the reason technology stocks lead the recovery back in 2009 is because the financial services sector was decimated. The destruction of the financial services sector left this sector unable to assist any recovery in the stock market direction higher. Therefore many investors turned to technology which has performed well up until this past fall. This could be signaling that the Financial Services sector is stepping back in to try to support the markets. I have watched the rise in the XLF Financial Sector ETF since the start of the year and there has been growing interest in the financial service stocks again.
If you look at the XLF chart below you can see that in early April the XLF reached $16.00 and then pulled back. This pullback occurred a few days before the market direction started to correct. But looking at the chart you can see that since bottoming in June the XLF has continued to push higher reaching $16.40 in September. The recent pullback which started in September was not very pronounced until November, but since then the XLF is once more pushing higher closing on Friday at $16.02.
If technology is starting to lose control of market direction up, the financials which in past markets was the sector to lead the market, may be finally starting to lead the market again. If the three technology stocks above fail to recover I will be watching XLF for any signals of a downturn. If the 3 large tech giants do not recover, but XLF moves higher, then market direction will be up and this will signal the return of the financial index to its lead role.
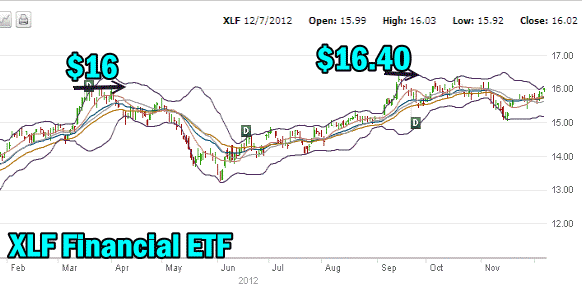
XLF Financial ETF Chart
By watching the above 3 stocks and 1 ETF investors have an early warning system for advising them when or if they should contemplate getting out of positions and buy inverse funds or puts for a downturn in market direction.
S&P 500 Market Direction Chart
In the market direction chart below you can see the consolidation of the market from this week. You can also see that the market is back making new higher lows as it tries to recover from the November correction. The S&P is back to the 50 period exponential moving average. This is the second attempt to break through resistance at the 50 period moving average. I am expecting market direction to be choppy but unless the fiscal cliff issue takes a turn for the worse, I believe the 50 period moving average will be broken and market direction will move higher.
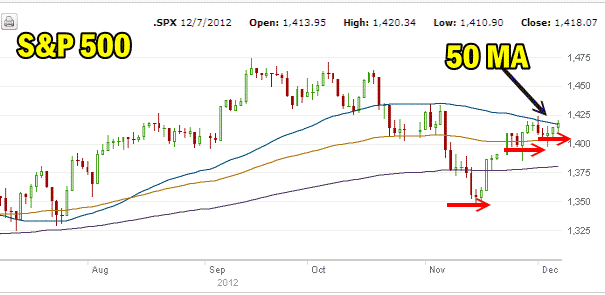
Market Direction Technical Analysis Dec 7 2012
Market Direction Technical Analysis Indicators – Dec 7 201
For Momentum I am using the 10 period. Momentum is still positive but Friday’s action has not turned it higher. It continues to fall. This is of concern as momentum indicates investor sentiment and for the markets to move higher sentiment has to improve.
For MACD Histogram I am using the Fast Points set at 13, Slow Points at 26 and Smoothing at 9. MACD (Moving Averages Convergence / Divergence) is still positive and is down slightly from Thursday but the readings are still clear. The signal is for the market direction to remain up.
The Ultimate Oscillator settings are Period 1 is 5, Period 2 is 10, Period 3 is 15, Factor 1 is 4, Factor 2 is 2 and Factor 3 is 1. These are not the default settings but are the settings I use with the S&P 500 chart set for 1 to 3 months.
The Ultimate Oscillator is still positive and is rising from the previous day, which is of course a good sign for a higher market direction.
Rate Of Change is set for a 21 period. Rate Of Change is still positive and it too is rising signaling a higher market direction.
For the Slow Stochastic I use the K period of 14 and D period of 3. The Slow Stochastic is overbought and close to a neutral reading although on Friday the reading was still market direction up..
For the Fast Stochastic I use the K period of 20 and D period of 5. These are not default settings but settings I set for the 1 to 3 month S&P 500 chart when it is set for daily. The Fast Stochastic is also overbought but the signal is solidly for the market direction to move higher.
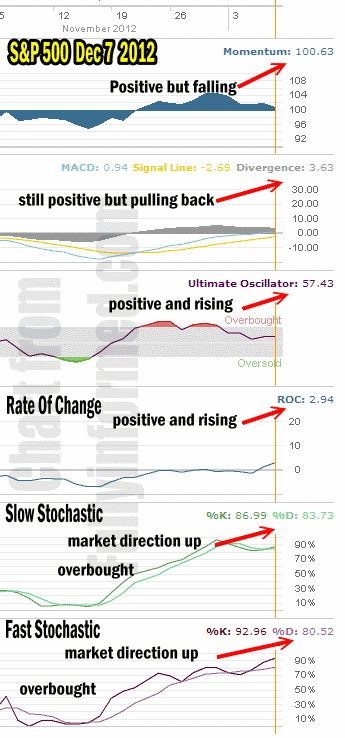
Market Direction technical Analysis for Dec 7 2012
Market Direction Technical Analysis Outlook
There are some worrying signs which particularly are coming from momentum. Momentum needs to improve for the market direction to push higher. But overall the consensus is for the market direction to continue to push higher. The overbought readings from the slow and fast stochastic indicators are good signs. They show there is still strength within the market. The rate of change now set for a 21 period is continuing to rise despite the weak markets last week.
The general consensus of the Market Direction Technical Analysis indicators is for the market direction to continue higher this week. The fast stochastic is signaling that the market direction should move higher on Monday Dec 8.
Market Direction Strategy
The strategy for market direction is unchanged. I am still selling naked puts on my favorite large cap dividend paying stocks. With the market direction up I am looking for any opportunity to close naked puts early which releases my capital for other naked put trades. I do not want to hold options into expiry with the market this high and the fiscal cliff looming. This week marks the options expiry for Dec 22 options. I have a lot of options set to expire. I will only look to close options early that are close to be in the money. Right now though my naked puts are either in the money like Intel Stock or out of the money but I will be keeping a close eye.
The Trading For Pennies Strategy has now entered my portfolio permanently as the returns are excellent for the amount of capital being invested. I have tripled my capital in the Trading For Pennies Strategy trades making the loss of capital should a trade go against me of little consequence.
Market Direction then for the start of the week is for the market to continue to break through the 50 period moving average and move higher.
Internal Market Direction Links
Understanding Short-Term Market Direction Signals
